If Your Company Has a Revenue Problem and Service Isn’t Part of the Growth Strategy, Fire the Leadership Team
How Leading Companies are leveraging sales in service revenue engine
Customer service is not a support function. It is the most underutilized revenue engine in the business.
Most organizations don’t have a demand problem. They don’t have a product problem.
They have a customer monetization problem.
Every day, thousands of customer interactions occur across service channels— moments where intent, timing, trust, and context converge.
And in most companies, those moments are handled correctly… but never monetized.
Not because the opportunity isn’t there. But because the operating model isn’t designed to capture it.
This is not “selling in service.”
This is precision
The right offer To the right customer At the right moment Through the right channel
And when orchestrated correctly, those moments don’t just resolve issues—
They generate millions in incremental revenue.
Before we break down how to do this, step back and look at the system holistically.
👉 This is what a fully engineered “sales in service” revenue engine actually looks like in Chart 1:Revenue Growth Engine Funnel
This model makes one thing clear:
Service doesn’t operate alone. It becomes powerful when it aggregates intelligence from across the enterprise and converts it into precision revenue actions in real time.
The Sales in Service Revenue Engine: 10 Commandments of High Performance
To operationalize this, elite organizations follow a disciplined model.
👉 Here is the complete blueprint in Chart 2, The 10 Commandments of Sales in Service:
Now let’s break down what this actually means in practice.
1. Redefine Service as a Revenue Engine
If your service organization is still measured primarily on cost efficiency, you’ve already lost.
Tie service directly to:
Net Revenue Retention (NRR)
Expansion revenue
Attach rates
Lifetime value
Industry benchmarks from OpenView Venture Partners show that top-performing SaaS and service organizations consistently outperform peers by prioritizing Net Revenue Retention (NRR) as a primary growth metric. Link to article: https://openviewpartners.com/saas-benchmarks/
This is not a support function. It is a monetization layer embedded inside customer interaction. It is leveraging sales in service revenue engine
2. Sell Outcomes, Not Products
Customers don’t buy because you offered something.
They buy because:
You identified a gap
You framed the impact
You solved something immediate
Diagnosis precedes monetization—always.
3. Engineer “Moments of Receptivity”
Not every interaction is sellable.
Top-performing organizations know exactly when customers are most open:
Post-resolution success moments
During friction discovery
At onboarding inflection points
Near renewal or value realization
Timing is the multiplier.
4. Arm Agents With Full Customer Intelligence
Without context, every offer feels random—and customers know it.
You need a true 360° view:
Usage patterns
Support history
Health scores
Lifecycle stage
This is where most organizations break.
Because that intelligence doesn’t live in one place.
WHERE THE MODEL ACTUALLY BREAKS (AND HOW TO FIX IT)
Most companies don’t fail because of intent. They fail because their customer intelligence is fragmented across functions.
👉 Here’s what’s really happening inside your organization today as depicted by Chart 3, Organizational Collaboration / Customer Service Hub
This chart exposes the truth:
Finance owns pricing signals
Product owns usage data
Marketing owns triggers
Sales owns targets
Engineering owns constraints
Customer Success owns health
And none of it is unified in real time.
Best-in-class organizations fix this by turning customer service into the central intelligence hub.
That’s when service becomes a revenue activation layer, not just a response function.
How Customer Advisory Boards Reveal New Revenue Streams Hidden in Your Existing Customer Base
Executive Summary
Many companies search for growth through new markets, acquisitions, or product expansion. Yet some of the most valuable revenue opportunities already exist inside their current customer base.
When organizations create structured environments where customers openly discuss challenges, future needs, and industry changes, entirely new revenue opportunities often emerge quickly.
Across multiple Customer Advisory Board (CAB) programs I have designed and facilitated, these conversations have uncovered more than $500 million in previously unidentified revenue opportunities. Additional significant revenue discovery is almost guaranteed in future customer advisory boards given the approach I am about to lay in this and future CAB topic series blog articles.
1. The Untapped Revenue Inside Your Customer Base
Most organizations pursue growth through new products, new markets, or acquisitions. While these strategies can generate results, they often overlook one of the largest opportunities already available: unmet customer needs.
Over the course of facilitating Customer Advisory Boards and executive focus groups across more than fifteen organizations, structured customer discussions have repeatedly surfaced revenue opportunities that were invisible in company data.
The discovery process is illustrated in Graphic 1: The $500M+ Customer Insight Funnel.
Graphic 1 illustrates how structured customer conversations reveal operational pain points and unmet needs. These insights move through a progression—from identifying unmet demand to validating opportunity areas and ultimately developing new revenue streams. Over time, organizations that systematically capture these insights convert customer conversations into a powerful engine for innovation and growth.
2. The Revenue Discovery Gap
If the opportunity exists within the customer base, why do many organizations fail to discover it? The answer lies in what can be described as the Revenue Discovery Gap.
Most organizations rely on three sources of insight: • Analytics data – reveals past behavior but rarely unmet needs • Sales conversations – focused on tactical issues • Internal innovation sessions – based on internal assumptions
These blind spots create what can be described as the Revenue Discovery Gap, illustrated in Graphic 2.
Graphic 2 highlights the difference between traditional insight sources and direct customer engagement. Analytics and internal brainstorming provide useful information but rarely uncover the deeper operational challenges customers face. Customer Advisory Boards close this gap by bringing customers directly into strategic conversations about future needs.
3. How Customer Advisory Boards Unlock New Revenue
Customer Advisory Boards create a structured forum where organizations engage directly with thoughtful customers about industry trends, operational challenges, and future needs.
The strategic value created through these conversations is illustrated in Graphic 3: The CAB Value Pyramid.
Graphic 3 illustrates how CAB programs create value across three layers. The foundation is customer insight, where structured dialogue reveals unmet needs. Those insights drive innovation and revenue creation, which ultimately leads to deeper strategic partnerships where customers become collaborators in shaping future solutions.
Real Examples: Revenue Generators That Emerged From CAB Conversations
Example 1 – Automotive Concierge Ownership Service
During a Customer Advisory Board discovery session with a group of vehicle owners and fleet customers, I asked a simple question that often reveals entirely new opportunities:
“What services would you pay for — or pay more for — that we don’t currently offer?”
The room quickly began discussing the complexity of managing every aspect of vehicle ownership.
Customers described the number of tasks required throughout a vehicle’s lifecycle:
• Scheduling routine maintenance • Coordinating service appointments • Arranging transportation while the vehicle is being serviced • Managing repairs and insurance claims • Organizing detailing and upkeep • Transporting vehicles between locations • Dealing with unexpected breakdowns or logistical issues
One customer summarized the frustration succinctly:
“Owning the vehicle is the easy part. Managing everything around it is the real headache.”
Several CAB members then converged on the same idea: they would gladly pay a reasonable premium for a fully managed automotive concierge service that would handle every operational aspect of vehicle ownership.
The proposed service would function as a single point of coordination for the entire vehicle lifecycle, managing:
• Maintenance scheduling and service logistics • Detailing and vehicle care • Transportation to remote or alternate locations • Insurance and repair coordination • Lifecycle tracking and vehicle replacement planning
In essence, customers were asking for a “vehicle ownership management service” where they never had to think about the operational details of maintaining their vehicle.
Multiple CAB participants emphasized that the service would not only save time but also reduce stress and uncertainty associated with vehicle ownership.
Several customers indicated they would be willing to pay $1,000–$2,500 per year per vehicle for such a service if it were executed reliably.
Across a large installed customer base, a premium concierge program like this could realistically yield $50–$120 million in new service revenue while simultaneously increasing customer loyalty and retention.
The insight did not emerge from product analytics, surveys, or internal brainstorming.
It emerged from a structured conversation among customers describing the real-world friction they experience every day.
Example 2 – Veteran Affinity Credit Card
In another Customer Advisory Board discovery session involving credit card customers, participants were discussing the emotional connection consumers increasingly want to feel with the brands they support.
Several CAB members raised the idea of financial products tied to causes that customers deeply care about.
One participant suggested an idea that quickly gained traction among the group:
A credit card specifically designed to support U.S. veterans.
Customers explained that many Americans actively look for ways to support veterans and veteran-focused organizations but often lack simple, everyday mechanisms to do so.
The CAB participants proposed a credit card that would direct a portion of card proceeds — such as transaction fees or annual membership fees — to vetted veteran support organizations.
The idea resonated strongly across the group for several reasons.
First, it allowed cardholders to support veterans through everyday spending rather than requiring separate charitable contributions.
Second, it provided a simple way for consumers to align their financial behavior with causes they care about.
Several CAB members indicated they would gladly pay a premium annual fee for such a card, viewing the additional cost as a meaningful way to contribute to veteran causes.
Participants also pointed out that no major financial institution had yet created a credit card explicitly structured around supporting veterans in this way.
Strategic Product Design
The financial institution ultimately designed a new credit card that maximized the benefits available under the Servicemembers Civil Relief Act (SCRA) and the Military Lending Act (MLA).
The product incorporated benefits such as waived annual fees, enhanced rewards programs, charitable contributions to veteran organizations, and other military-focused features that made the card uniquely attractive to veterans, active-duty service members, and the millions of Americans who support them.
By aligning the product design with existing military consumer protection frameworks, the institution was able to create a differentiated financial product while maintaining full regulatory compliance.
This meant the concept could serve not only as a new product offering but also as a powerful market differentiator capable of attracting an entirely new audience of customers motivated by purpose-driven financial products.
CAB participants suggested that the product could appeal not only to veterans and military families but also to the millions of Americans who actively support veteran-focused initiatives.
With the right positioning and partnerships with credible veteran organizations, such a product could realistically yield $30–$75 million in new annual revenue through a combination of annual fees, transaction volume, and expanded card adoption.
More importantly, it would position the issuing financial institution as a brand aligned with a cause that resonates deeply with many consumers.
Once again, the idea did not originate inside the company.
The idea and new revenue stream came directly from customers when they were invited to participate in shaping the future of the products they use.
Example 3 – Predictive Maintenance & Failure Prevention Services
During a Customer Advisory Board discussion involving enterprise equipment operators and fleet managers, participants began describing a common operational frustration: unexpected equipment failures that created costly downtime and disrupted operations.
Several CAB members explained that while existing products performed well, they lacked advanced tools that could predict failures before they occurred.
Customers suggested that if the company could combine equipment telemetry, operational data, and predictive analytics into a monitoring service, they would gladly pay a subscription fee for predictive maintenance insights that would help them prevent downtime.
The proposed solution included:
• Continuous monitoring of equipment performance data • Predictive alerts for potential failures • Maintenance scheduling recommendations • Performance optimization insights across fleets or facilities
Customers emphasized that avoiding even a single major failure could save tens or hundreds of thousands of dollars in operational disruption.
Because of that, they viewed the service not as a cost, but as an operational insurance policy.
Several CAB members indicated they would be willing to pay $500–$2,000 per asset annually for such a service.
When applied across large installed equipment bases, this type of predictive maintenance platform could yield $40–$80 million in annual recurring revenue while simultaneously improving customer uptime and satisfaction.
In many industries, the shift from reactive support to predictive service has become one of the fastest-growing sources of new service revenue.
Example 4 – Industry Benchmarking & Performance Intelligence Platform
In another Customer Advisory Board session involving senior leaders from multiple organizations within the same industry, participants began discussing a challenge many of them shared.
While each company collected extensive internal performance data, they had very little visibility into how their operations compared to industry peers.
CAB participants expressed strong interest in an industry benchmarking and performance intelligence platform that could provide anonymized insights across participating organizations.
Customers explained that access to credible benchmarking data would help them make better strategic decisions, justify internal investments, and identify performance gaps earlier.
Several participants suggested they would gladly pay for such insight if it were provided by a trusted industry partner.
CAB members proposed a subscription-based benchmarking service available to participating organizations.
Early estimates from CAB participants suggested companies would pay between $50,000 and $150,000 annually for access to credible industry benchmarking intelligence.
If adopted across even a modest number of customers within the ecosystem, such a platform could yield $25–$60 million in recurring annual revenue, while positioning the provider as a trusted strategic intelligence partner within the industry.
In addition to the direct revenue opportunity, these types of platforms often strengthen customer relationships because they provide ongoing strategic insight rather than simply operational support.
4. The Revenue Discovery Framework
Organizations that consistently uncover meaningful revenue opportunities through CAB programs typically follow a structured process.
Step 1– Identify the Right Customers Step 2– Curate the Advisory Board Step 3– Design the Discussion Step 4– Facilitate Discovery
Step 4 – Facilitate Discovery (deeper dive, sample content of next blog topic on CABs)
Even with the right participants and discussion topics, the role of facilitation remains critical. The quality of insights generated during a Customer Advisory Board (CAB) session depends heavily on whether participants feel comfortable sharing candid perspectives—even when that feedback may challenge existing products, services, or strategies.
To create an environment where honest dialogue can occur, I begin every CAB session by establishing a simple set of ground rules designed to encourage openness, respect, and constructive debate.
CAB Ground Rules for Productive Discovery
Ground Rule #1 – Radical Honesty Is Expected All ideas and comments are welcome, no matter how negative they may be. If we are going to improve, we need complete honesty. I often remind participants of an old saying: only your best and most trusted friend would tell you that you have a dirty face or bad breath. The same principle applies here—honest feedback is a sign of trust.
Ground Rule #2 – Candor Will Never Be Penalized No feedback, regardless of its severity, will ever cause leadership to view participants negatively. On the contrary, those who share completely honest perspectives will be valued as trusted advisors to the brand.
Ground Rule #3 – Challenge Assumptions Participants are encouraged to speak openly and challenge assumptions. Many of the most valuable insights emerge when customers question ideas that organizations have long taken for granted.
Ground Rule #4 – Respect Every Voice Only one person speaks at a time, and all participants must respect each other’s viewpoints and perspectives. Productive CAB sessions depend on thoughtful listening as much as thoughtful speaking.
Ground Rule #5 – Think Like Owners As with brainstorming, no suggestion or criticism is off-limits. Every idea will be treated with respect and serious consideration. During the session, participants are not simply customers, they are co-CEOs helping shape the future of the company.
Segueing from this final ground rule, I then introduce an exercise designed to shift the mindset of the room even further.
Graphic 3A – Participant Certification of Company Ownership.
To shift the conversation from customer feedback to strategic thinking, each participant receives a Certificate of Ownership above that symbolically appoints them as the temporary owner and CEO of the company for the duration of the CAB session.
After distributing the certificates, I explain:
For new customer led problem identification and rectification focused sessions, the question becomes“For the next few hours, you are the owners of this company. You can change anything you want—products, services, pricing, policies, strategy, or how we operate.”
For customer led new revenue focused sessions, the question becomes “For the next few hours, you are the owners of this company. You need to focus on new revenue generation ideas that would sell easily – new products, services, premium services, events, partnerships, etc.”
Participants are then asked a simple but powerful question:
“If you owned this company, what changes would you make on day one, week one, and month one?”
This exercise immediately moves participants from the mindset of customers providing feedback to owners responsible for improving the business. The result is more candid conversations, more strategic thinking, and insights that rarely surface in traditional customer meetings.
A deeper look at the full methodology behind designing and facilitating high-impact CAB sessions, including facilitation techniques, session structures, and insight extraction frameworks will be covered in the next article in this series:
This process is illustrated in Graphic 4: The Revenue Discovery Framework.
Graphic 4 above shows how organizations move from customer insight to measurable revenue creation. Each stage builds upon the previous one, transforming structured customer conversations into a repeatable pipeline for innovation and growth.
5. Strategic Benefits Beyond Revenue
While CAB programs are powerful engines for uncovering new revenue, their impact extends far beyond innovation alone. They strengthen customer relationships and can serve as an early warning system for emerging risks.
This dynamic is illustrated in Graphic 5: The Loyalty Multiplier Effect.
Graphic 5 shows how including customers in strategic conversations creates a reinforcing cycle of engagement, advocacy, and loyalty. When customers help shape solutions, they often become advocates for the brand and long‑term partners in its success.
6. Types of Revenue Opportunities CABs Reveal
Revenue opportunities uncovered through CAB discussions typically fall into four categories:
• New services • Premium offerings • Product enhancements • Entirely new offerings These categories are illustrated in Graphic 6: The Revenue Opportunity Spectrum.
Graphic 6 demonstrates how CAB insights often begin with incremental opportunities such as services or premium offerings and can expand into entirely new products or businesses.
Internal brainstorming generates ideas, but it often lacks market validation. Customer Advisory Boards introduce perspectives internal teams cannot replicate.
The difference between internal ideas and customer‑validated insight is shown in Graphic 7.
Graphic 7 highlights how internal brainstorming often produces ideas based on assumptions, while customer‑driven innovation begins with real operational problems and validated demand.
The Strategic Imperative
Many successful growth strategies begin in the same place: a room full of customers sharing honest perspectives about their challenges and future needs.
The overall strategic impact of customer‑driven discovery is summarized in Graphic 8, Strategic Impact of Customer‑Driven Discovery.
Graphic 8 reinforces the central idea of this article: when organizations systematically involve customers in shaping their future, they unlock new revenue streams, stronger loyalty, and long‑term strategic partnerships.
“Every company has untapped revenue hiding inside its customer base. The companies that discover it first are the ones willing to ask their customers the right questions.”
The Experience Behind This Perspective
The ideas presented here are grounded in more than four decades of work in customer strategy, customer experience, consulting, and technology leadership.
I have worked with or consulted for organizations including Lockheed‑Martin, Carrier, General Electric, IBM Global Services, PricewaterhouseCoopers, Unisys, Accenture, Cox Automotive, Wave Systems, INEOS Automotive, American Express, Microsoft, Samsung, AT&T, Verizon, Pfizer, Capital One, Toyota, Amazon, Google, Oracle, Adobe, Southwest Airlines, Delta Airlines, Siemens, Wells Fargo and many others.
An Invitation to C‑Suite Leaders
If you are a CEO, Chief Customer Officer, Chief Revenue Officer, or senior executive seeking to uncover new growth opportunities while strengthening customer relationships, I would welcome the opportunity to speak with you.
Customer Advisory Boards are one of the most powerful, and most underutilized, strategic tools available to executive leadership teams.
When designed and facilitated correctly, CAB programs do far more than generate feedback. They uncover entirely new revenue streams, reveal emerging market risks before they become crises, and transform customers into strategic partners in shaping a company’s future.
Over the past four decades working with global enterprises across industries—including financial services, automotive, technology, healthcare, and manufacturing—I have helped organizations design and lead Customer Advisory Boards that have revealed hundreds of millions of dollars in new revenue opportunities while simultaneously strengthening long-term customer loyalty and advocacy.
In the next three articles in this series, I will go deeper into the mechanics behind these outcomes, including:
How to Design and Run World-Class Customer Advisory Boards that consistently produce strategic insight and breakthrough ideas.
How Leading Companies Convert Customer Insight Into Revenue, transforming CAB conversations into new services, premium offerings, and entirely new business models.
The Hidden Strategic Value of Customer Advisory Boards, including how trusted CAB members can serve as early-warning systems for emerging operational, regulatory, and market risks.
Because when companies move customers from the sidelines into the strategy room, they don’t just learn more about their markets.
They start discovering opportunities their competitors haven’t even seen yet.
The value and ROI of having a world-class sales process.
The top 10 benefits to having a clearly articulated sales process and associated methodology.
The specific components & elements within each detailed sales process that enables the sales team to maximize their effectiveness.
Sample sales metrics that should be collected as part of an overall sales process.
How a sales process helps align corporate communications and actions toward winning each and every sale.
How to infuse sales best practices right into your sales process at every stage of the sales cycle.
How to ensure all levels of the sales teams actions are coordinated in terms of communications, hand-offs, approvals, sales readiness, etc.
How a leading practices sales process will actually ensure that you deliver an optimum customer experience where customers will buy more and become loyal.
How a best practice based sales methodology will ensure your sales team is fully accountable for results and for the sales funnel.
Why a sales process can make it easier to on-board, train and retain a high performing sales team.
What critical sales process steps you can be automated once the sales process is fully developed and why sales automation alone (out of the box) won’t deliver sales process excellence.
How you can leverage artificial intelligence and robotic process automation (RPA) to offload mundane, lower value tasks from the sales team.
Proven and effective sales best practices I have diffused at various Fortune 500 company clients.
B) The Top 10 Reasons Developing & Maintaining a World-Class Sales Process is valuable for you and your company:
Holds Sales Team Staff and Management Accountable
By having performance measures and toll gates baked right into the overall sales process, you can hold team members accountable for reaching select performance levels at each phase of the sales process
Provides a clear & proven path for sales reps to close deals.
By having clearly defined best practice based steps and milestones that guide sales team members, from prospecting to proposal presentation, your company can avoid losing sales deals due to disorganization.
World-class sales processes contain within them the definition of your entire sales communication process including the roles of each department supporting the sales process. This feature of the sales process definition ensures everyone is on the same page and collaborating and communicating at each critical juncture of the sales process to ensure the sale is won.
Enables more efficient and effective on-boarding of new sales members
A standardized sales process makes training sales reps fast, simple, and nearly foolproof, by showing salespeople what they need to do in various sales situations without having to tie up the sales manager in the (re) training process. In addition, when the entire sales team is following the same road-map, any member of the existing sales team can pass on their knowledge and guidance to new hires.
Provides the ability to constantly improve sales processes and methods.
Successful sales teams continuously refine their sales processes based on the collection of measurable data and constant feedback that will be built right into any world-class sales process. For example, understanding where most of your sales deals are getting bogged down or lost can help you identify the root cause of why those deals were stalled or lost and take steps to re-engineer the sales process. Without a process in place, deals are simply won or lost, and it’s hard to know which specific actions are succeeding or failing.
Delivers better forecasting with higher predictability of sales and revenue.
A repeatable sales process provides sales teams with greater consistency in winning deals. Having a more accurate sense of your overall sales win rate enables your company to dependably forecast how many sales you’ll close from a given number of leads, and helps sales managers set realistic team member sales quotas.
Drives more qualified leads, increased lifetime value, revenue and profitability
A well honed sales process also enables your sales team to be more effective at filtering out low-potential leads and identifying prospects that are most likely to purchase your product. Generating greater volumes of higher-quality leads shortens your sales cycle and reduces the effort wasted on lower probability sales deals. This also ensures that your sales team focuses its efforts on the activities that deliver the most revenue and the highest levels of profitability.
Enables improved communication between sales and supporting teams.
By having your sales team speaking a common company language (vs. sales specific) it can enable better collaboration among sales team members and with supporting company departments. A standardized best practice sales process contains common steps and common language that delivers simplified inter-company communication, reduces inter-departmental confusion, and enables your accounting, customer service, fulfillment, and marketing teams to provide the right sales actions and content at the right time. The following chart is an example of developing a framework for how various sales team members communicate, share and update information, etc.
9. Provides greater measurement of sales team performance
When a sales team has no standardized sales process to follow, it is difficult to measure anything except for wins and losses. A standardized sales process has built into it more data measurement points at each phase of the sales process, allowing for deeper analysis of key sales performance metrics and targets.
10. Delivers a better overall customer experience.
When a sales representative pressures a prospect into a sales stage they are not comfortable with, it can create mistrust, which can negate the sale and damage the relationship with the buyer. A standardized sales process ensures that sales team members and managers do not advance the sale until the prospect is ready to move forward. A best practice sales process also is designed to reflect how each prospect (customized via prospect analytics and profiling) would want to move through the buying process, and making sure each step is designed (customized) to generate maximum trust and value. In this manner the sales process enables sales teams to deliver an optimum and positive customer experience during each sales phase.
C) Global Sales Major Process Definition
World-Class Sales Process Framework
The above is a sanitized version of the highest level sales process architecture I developed for a global consumer products company. This “level 1” foundation sales process architecture depicts the major processes and supporting processes for the overall company sales process. Each of these major process modules will each be further broken down in detail until the actual process steps, procedures and policies are of sufficient detail that they can be clearly followed by all sales stakeholders (sales manages, sales team members, departments supporting the sales team, senior management, etc.).
Level 2 Process Flow, Sales Planning & Forecasting
D) Sales Process Detailed Definition – Responsibilities and Major Processes
Breaking down the major 1.0 level sales process, we flow into the next level of detail for the S.1.0 process which is “Planning and Forecasting” for sales.
Level 2 / 3 Sales Process, Update Sales Forecast
Within the “Planning and Forecasting” module we depicted the major coordination and communications that occur with this Level 2 process. The horizontal subdivisions (a.k.a. swim lanes) shows a high level breakdown of responsibilities within the sales organization and between the various functions, regions, etc. This was important for this client since it mapped out who did what and at what level to end up with either a new or revised sales forecast.
Level 3 Sales Process, Update Sales Forecast
E) Sales Process Detailed Definition – Steps, Decision Support, KPIs, Best Practices, Key Metrics
Using the “Updated Forecast” process as an example, we then show the level 3 detail of this sales process.
Level 3 Sales Process, Update Sales Forecast
As shown above, typically a level 3 or 4 process flow contains the sales process detail for it to be actionable by the sales team and supporting team (accounting, IT, fulfillment, product management, customer service, etc.).
Level 3 Sales Process, Update Sales Forecast : Specific Elements Detailed
F) Detailed Sales Process – Definition of each step & components:
Let’s examine each of the 4 major elements of this level 3.0 process flow titled “Update Forecast”.
The first element we examine is the flow from another detailed process step, “Review Period to Date Results”, that has a number of inputs that into this process step “Update Forecast” at the Division level that include (sample) the following sales period to date information:
Projected sales volume vs. actual results
Sales representatives goals vs. actual results
# of closed sales deals and at risk-deals vs. planned
Profitability per deal vs. target
Total revenue and profit for all cumulative sales deals vs. target
Sales Process Step 1 Detailed, Update Sales Forecast
The 1st process element we examine is the examination and decision based on actual vs. planned period to date sales KPIs as follows:
Are we maintaining an upward linear growth rate as planned
Sales Process Step 2 Detailed, Update Sales Forecast
If key sales planned period to date KPIs are at risk based on a certain threshold, we move to the 2nd element where we update a number of pre-determined KPIs that are critical to ensuring we have an accurate sales forecast. In this sample, my client decided that these are as follows (sample):
Sales targets
Key sales assumptions (totals and per deal)
Sales benchmarks (top performance vs. average vs. lagging)
Sales process (i.e. adjust at-risk deal processes to match on the ground situations for each deal)
Sales team accountability plans (adjust according to 1-4 above).
Sales Process Step 2A Detailed, Update Sales Forecast
If they are not at major risk, we might update a few smaller parameters and then move onto process step 2A.
Sales Process Step 3 Detailed, Update Sales Forecast
The 3rd process element we examine is the examination and decision based on sales project results for period end KPIs as follows (sample):
Are lead flow projected rates at previously forecast levels?
Are the numbers of late stage sales deals on track to close in the period end (monthly for my client)?
Based on the deals closing in #2 above, does the aggregate revenue for those deals match the projected forecast for period end?
Specific to this process step, we have an embedded best practice “BP”. This best practice details that if pipeline coverage of sales representatives drops below 85%, an automated process (with its own set of best practice procedures), kicks off titled “Recovery Plan S.1.0” that will return coverage of pipeline to 100%.
Sales Process Step 4 Detailed, Update Sales Forecast
If key sales project results for period end KPIs are at risk based on a certain threshold, we move to the 4th element where we simply update the key sales projections and KPIs based on investigating and validating actual sales actions, feedback, roadblocks, prospect and customer actions, etc. These include (small sample of actual client metrics) the following:
At-risk deals (#’s, specific names, assigned representatives, etc.)
Top deal watch list (revenue and margin #’s, names/clients, roadblocks, action plan status, etc.)
Low sales performer watch list (names, action plans, mentor-ships, etc.)
Sales Process Step 4A Detailed, Update Sales Forecast
If there are no major risks, we might update a few smaller parameters and then move onto process step 4A where we simply exit this process and enter another downstream process.
Sales Process Step G (Global Process Best Practices) Detailed, Update Sales Forecast
A global element in this update forecast process is the embedded best practices that have been developed as a result of evolving the sales process continuously. These include (small sample):
Flagging the top 5 (based on revenue, important to company) at-risk sales deals.
Performing a weekly review of at-risk sales deals and coming up with an action plan for each, taking into account any sales process changes made above in element 3, step 4).
Updating the following metrics, key for sales management visibility:
Number of at-risk deals weekly, monthly, YOY, etc.
The success ratio of closed top deals vs. top deals lost.
Average sales cycle duration & actual sales representative time spent selling.
Other Key sales metrics for the overall sales process to consider:
Overall sales win rate.
Average deal size.
Lead average follow-up time. (The time a lead is received until a sale representative follows-up)
Sales by lead source (important marketing to sales metric).
Quota achievement % total and by sales representative.
Based on a-c (and more) above, what are the action plans and automated workflows that need to be created to enact updated performance plan metrics?
G) Sales Process Automation:
There is a huge difference between sales automation and sales process automation. Just because you purchased leading tools like Salesforce, Microsoft, Oracle, Zoho, etc. does not mean it will conform or deliver a highly automated sales process right out of the box. These tools can be customized to accommodate the automation of your sales process, but will take additional $$, effort and potentially additional licenses that you may not have accounted for in the initial expenditure of funds and resources. This step is as important as purchasing the package since without easy to use functionality and processes that aid the sales effort, the tool will be considered more of a hindrance that a help.
You will also need to automate your sales process via a number of other supporting tools that salesforce automation software packages are not optimized for out of the box such as the following:
E-mail process automation like triggered responses to new lead inquiries or automated bots on the website to interact and respond to simple initial inquiries.
Report generation being triggered based on system parameters, timing and critical thresholds being reached. Add on packages like Adobe, Tableau, Microstrategy, Oracle BI, SAS, Sisense, etc. all are great packages that can be added to bring additional horsepower to your sales analytics and reporting capabilities.
Artificial intelligence and robotic process automation (RPA) can aid in the performance of sales tasks such as lead distribution, auto-populating CRM systems via intelligent voice capture and data mining following a phone sales call.
Pipeline & Order Management – tools like Vendasta can help automate the management of your pipeline and order management.
H) Other Sales Best Practices to Kick Your Sales Volume & Success into Overdrive:
While these are not related to the above sales process per say, I have included these as they are sales related and **some** clients choose to implement these practices, processes:
Analyze sales rainmaker activities & behavior and then replicate their best practices back into the overall sales process, training, activities, sales approaches. In this manner good sales reps move up to rainmaker performance, average sales reps move up to good performance, etc. I did this for a major U.S. insurance company a few years ago and it improved their overall sales performance by 32%!
Develop a referral incentive system with your existing customers as existing customer referrals are likely to close 50+% of the time, with strong personal referrals with testimonials likely to close at 80+%. Compare this to warm leads at <30% and cool leads at <15%. I did this as the SVP of Operations at a startup and it catapulted our sales from <$1m to over $3m in just 8 months.
Develop a network of complimentary re-sellers (a.k.a. channel sellers) of your services where the products and/or services you sell are complimentary to the re-sellers normal line business. For example, a firm that sells cultural improvement and/or leadership development services should be seeking out an HR consulting firm to resell their services since the HR firm is uncovering these needs on a regular basis with generally nowhere to turn for servicing unearthed client needs. The HR consulting firm would then net a commission (5-10%) for merely opening the door to the new sales opportunity for the leadership development firm. Analogous to this on the web is affiliate sales and marketing.
Invite satisfied customers to participate in the brand: guest blogger, posting testimonials, reviewing new concepts, products and/or services, participating on a Customer Advisory Board (e.g. top customers), etc. Studies have shown that the more they are invited to participate in the brand’s success, the more likely they are to share your brand’s success.
Let your existing customers know about your sales wins: The more your customers see you succeed and the strides your are making in the marketplace, the more likely they are to share these positive news stories. Examples: xyz company is winning contracts left and right, they must be doing something right, xyz is on fire, xyz services are selling like hotcakes, etc.
Related to the above topic, does your organization need consulting assistance developing and implementing a world-class sales process or any of the following: associated services?
Replicating the processes and behavior of your sales rainmakers to the rest of the sales team?
Infusing a set of sales cross-industry leading practices in your existing sales process?
Developing a best practice sales measurement and metric system?
Automating the sales process to offload the non-value sales tasks from your sales team so they can focus on meeting with prospects/customers and closing deals?
Investigate how to apply Artificial Intelligence (AI) and Robotic Process Automation (RPA) to sharpen your sales insights, targeting, lead generation flow, etc.?
If so, give me a call, I call help you implement sales process excellence that will enable you to surpass your competition and bring your organization to the next level of sales performance and revenue.
Lastly, this is just one article of nearly 50 total I have written on Customer strategy, CRM, marketing, product management, competitive intelligence, corporate innovation, change management – all of which I have significant experience in delivering for Fortune 500 companies. In fact, my blog is now followed by nearly 120,000+ world-wide and was just named one of the top 100 CRM blogs on the planet by Feedspot, alongside Salesforce.com, Infor, Microsoft, SAS, etc. – Reference this informative site here: https://blog.feedspot.com/crm_blogs/
Continuous Marketing Process Assessment & Improvement
Are you as a CxO so focused on the tasks at hand that you don’t take the time to re-group and assess what is working and not working? Likewise, are you too focused to take the time to determine what in your operations is effective and what corrective action is needed on a ongoing, consistent basis?
Are you “operations bound” whereby your team members are out of bandwidth due to barely keeping up with ongoing marketing, sales, communications and PR production schedules?
Do you find the company getting further and further behind competitors capabilities, effectiveness, market presence as well as sales volume?
Are you behind on learning the latest capabilities and advances in digital asset management, marketing & content management artificial intelligence (AI), and how block-chain can help your effectiveness?
Per question #4 do you know how these advances can improve the effectiveness in your marketing, sales, PR, communications while simultaneously increasing profitable revenue while simultaneously reducing your operating costs?
If you answered “yes” to any of the above questions, you are really in need of a Marketing Process Improvement (MPI) initiative and an infusion of a ‘Saw Sharpening” process. The benefit of implementing this continuous improvement process is that your company will increase the chance that it will evolve into the envy of the marketplace in terms of team leadership, capabilities and overall market effectiveness.
The remainder of this blog is a short primer and motivator in getting your company to consider becoming a ‘Saw Sharpening’ organization focused on improving profitability, market share and overall shareholder value improvement.
Marketing Capability Tier Evolution
Complimentary to the first set of questions above:
Have you mapped out how capable your company is in terms of marketing, customer management, sales, etc. such that you can accurately place your company into a capability level as shown in the above chart?
Have you created an evolutionary road-map in order to mature your organization into a more capable and effective organization over time (i.e. lower expenses and increase profitable revenue) in order to leapfrog your competition and gain market share?
Can you accurately assess your competitor(s) capabilities such that you know where they are better than your company and in which specific areas?
Sharpening the Marketing Saw to Transform to attain Intelligent Marketing Enterprise (IME) (i.e. Capabilities, Efficiencies, Effectiveness)
The last set of questions are associated with answering whether you are aware of the entire landscape of capability improvement initiatives available to assist your company’s marketing, customer management, sales, PR and communications (refer to above chart). These questions are as follows:
Are you aware that business rules engine technology can help you automate your marketing campaign management process such that marketers do not have to be as manually involved (i.e. campaign set up, execution and post campaign results analysis)? This technology will save your company time and $$ by allowing your marketers to focus on all important marketing strategy vs. being ‘campaign jockeys’ and marketing production focused most of their time.
Are you aware that powerful and real-time analytic engines can help with channel mix optimization such that you are marketing to the most effective and cost efficient customer channel at all times?
Are you aware that leading Digital Asset Management (DAM) tools now have artificial intelligence baked right in as to help you manage, find and retrieve your digital assets across marketing, PR, sales, communications, etc. – all saving you time and enabling your content to be more compelling to your customers?
Associated with question #3, are you really aware of the benefits of Digital Asset Management (DAM) tools and how it can help you go to market more effectively and cost efficiently?
If you answered “no” to any of the above questions, then you are not performing adequate MPI or ‘saw sharpening’ to improve your performance longer-term. As an example of what you might be missing in not performing MPI and marketing saw sharpening, I laid out the benefits of adopting Digital Asset Management (DAM) tools which not only helps the marketing department, but also PR, communications, sales, etc. (Don’t read ahead and let me know if you were able to guess all 7 benefits of a Digital Asset Management (DAM) solution):
Eliminates the cost of lost or misplaced digital assets. DAM virtually eliminates the costs associated with losing valuable digital assets due to the robust and highly organized digital asset repository (via a highly logical DAM taxonomy) which enables marketers to find and (re)use digital assets quickly.
Reduces creative production development cycle times. DAM tools help users quickly create and re-purpose digital assets.
Reduces the time to bring new campaigns to market. Marketers, sales, PR, communication, etc. are able to get campaign related digital out to various markets and customers at the ‘speed of need’.
Eliminates duplication of work. The central asset repository that DAM provides greatly reduces the possibility of costly asset duplication.
Improves collaboration and access to critical assets. DAM tools facilitate collaboration among marketers via a centralized control of digital assets.
Ensures brand consistency and brand integrity.Ensures marketers, sales, PR, communication, etc. have access to the most up-to-date digital assets as opposed to users being allowed to select non brand compliant assets.
Improves Marketing ROI: Enables marketers, sales, PR, communication, etc to use the most effective digital assets that will produce the greatest impact and ROI.
If you answered “yes” to some of my first set of questions and “no” to many of the 2nd and 3rd set of questions and missed the some of the benefits associated with DAM tools, then you are a prime candidate to infuse an MPI or marketing (or overall) saw sharpening process into your company. Based on having helped numerous Fortune 500 companies establish this continuous improvement mindset, approach and process, I suggest the following:
Honestly assess whether your team feels as though your company is as capable as it needs to be – processes not too manual, error prone, ineffective, lagging as compared to competitors, wrong approach and strategy, inefficient tactics, etc.
Set time aside each week for team saw sharpening activities and to discuss initiatives you need to implement to improve capabilities and overall effectiveness.
Benchmark your performance in certain areas like e-mail open and click through rates, sales $$ per campaign, campaign cycle time and/or accuracy, Google ad-words performance, etc., net promoter score(s) and constantly challenge the team to improve incrementally as well as dramatically after the implementation of new capabilities.
Hire an honest, impartial outside consultant to independently assess your capabilities and benchmark these capability areas against market leaders.
Leverage a consultant to help you develop an evolution roadmap over 2-5 years for your company to attain market leader status including business case with investment and capability implementation plan.
Is your organization planning on launching a new brand or optimizing an existing one? If so, give me a call or e-mail me, I can help you implement a MPI or ‘Saw Sharpening’ process that would enable you to surpass your competition and bring your organization or agency to the next level of market effectiveness and excellence.
This is just one article of 42 total I have written on Customer strategy, CRM, marketing, product management, competitive intelligence, corporate innovation, organization excellence & change management – all of which I have significant experience in delivering for Fortune 500 companies. In fact, my blog is now followed by nearly 158,000+ world-wide and was just named one of the top 100 CRM blogs on the planet by Feedspot, alongside Salesforce.com, Infor, Microsoft, SAS, etc. – Reference this informative site here: https://blog.feedspot.com/crm_blogs/
Major Stages of The Customer Relationship Life-cycle
The first step in developing the optimal customer relationship is to define the various major phases in your customer’s journey as they interact with your company (i.e. customer acquisition through customer retirement/closure).
The subsequent steps in the process are to define the phase objectives of each major customer relationship life-cycle stage and to determine the range of customer treatments, by customer segment, that exist within each phase. In addition, in order to arrive at accurate segmentation definitions, a segmentation approach and method must be defined in order to properly develop distinct and meaningful customer segments groups.
Balancing Customer Service Costs with Customer Needs & Satisfaction
Once customer value segments are properly determined, customer needs and appropriate service levels for those segments can be determined. This is important to delivering cost effective service levels that doesn’t over-deliver to customers and ensures a maximized customer satisfaction level for that particular customer segment group. Equilibrium is achieved when customer service costs are balanced with delivered customer satisfaction and customer value (i.e. a company would not want to expend a great deal to over-deliver to a traditionally frugal customer segment with a negative contribution (value) margin).
Matching Customer Service Delivery Levels to Customer Value
As customers deliver greater value to the company, service and reward levels are adjusted to deliver increasing levels of customer value to maintain market equilibrium and prevent high value customer defection to competitors.
Architect The Cost Effective Customized Customer Experience Across All Touch Points
Each customer touch-point needs to be examined to determine the optimal customer treatment approach for each customer segment that interacts with that particular touch-point. Only then can an econometric model can be developed via a multi-dimensional matrix of customer touch-point, customer value segment and customer relationship life-cycle stage.
Developing The Optimal Customer Relationship across all touch-points, segments, customer life-cycle stages
The final multi-dimensional matrix developed should consist of 4 dimensions (comparable to a Rubik’s Cube) of 1) Customer touch-point; 2) Customer Needs/Preferences; 3) Customer value segment and 4) Customer relationship Life-cycle Stages (CRLS).
Developing the Optimal Customer Relationship Life-cycle
I have found that the best approach to determining the final multi-dimensional matrix developed to be through a series of cross-functional workshops with internal knowledge experts consisting of customer analytics, customer service, marketing, sales, warranty claims (if separate from service) and touch-point subject matter experts like website managers, multi-channel contact center managers, etc.
The above is the structure for determining the optimal customer relationship for each segment group per touch-point as they transit through the customer relationship life-cycle stages. The final outcome is your delivered customer treatment strategy across all touch-points, segments and stages in the customer relationship life-cycle.
The benefit of this requirements definition exercise is minimized customer service cost at a level that just meets (or slightly exceeds) customer expectations such that high levels of customer satisfaction is delivered at the ‘maximum bang for the buck’.
The following is an array of insights that I created for a client who represents one of the top luxury resort companies in the world. These insights were designed to accomplish the following:
Develop Financial and market Insights to Increase revenue while decreasing costs
Increase standing in the marketplace relative to the competition
Help understand the market dynamics of the target market
Assist in identifying root causes for customer purchases, repeat purchases and the opportunity they have to boost customer loyalty
Improve the effectiveness of current marketing efforts by more effectively leveraging market insights
Develop a 5-year transformation plan to enable new capabilities that allow them to fulfill their future vision state
Best Practice Market Trend Analysis
{Click on Graphic for clearer/larger image}
Effective market analysis must include insights into market trends: Growth, Capacity and Expansion
Market Capacity Analysis
Best Practice Market Capacity/Growth Analysis & Insights
{Click on Graphic for clearer/larger image}
Best Practice Market Supply & Demand Analysis
{Click on Graphic for clearer/larger image}
World-Class Market Supply & Demand Analysis including Market Trend Analysis
Market & Competitor Price Analysis – Comparison
Market Competitive Pricing Analysis
{Click on Graphic for clearer/larger image}
Competitive Pricing Analysis
Market & Brand Competitive Pricing Analysis
{Click on Graphic for clearer/larger image}
Brand Pricing Consistency Analysis
Company Net Daily Revenue Analysis
{Click on Graphic for clearer/larger image}
Target Market Sizing Analysis
Market Profiling, Sizing & Penetration Analysis Example
In order for your company to get the most out of social media marketing, you’ll have to identify where along the customer conversion funnel (CCF) your customers may be dropping out. Just one bottleneck in the funnel can severely limit your revenues as well as customer return business.
Bottlenecks in your CCF can cause the following problems:
1) Reduces the effectiveness of advertising campaigns
2) Prevents potential customers from fully understanding the benefits of your products
3) Frustrates users and prevents them from being able to purchase an item
4) Keeps customers from returning
5) Discourages users from promoting your products
What is the Customer Conversion Funnel (CCF)?
The CCF is the path a consumer takes from being aware that the service or product and/or service exists, to finding out more information about the product/service, to finally buying the product. The e-commerce conversion funnel also includes the two further steps, which are loyalty and advocacy. Social Media can enhance each step of the way
Revenue Loyalty Formula
A Mathematical Viewpoint
Many view revenue as a simple equation, Revenue = Sales Price * Quantity Sold. This simplistic view overlooks the intricacies of the entire model. This basic formula can then be broken down into the segments of the pipeline itself. Viewing the second equation below, Price*Quantity is a function of the percent interested in your products, those who understand your products, and those who are not frustrated by your checkout process.From there, you should look at customer loyalty as a multiplier and their advocacy, usually done by those loyal to your brand increases. This exponentially as they are able to push outreach organically
Telltale signs of Bottlenecks in your Conversion Funnel
1) There is a market need for the products and services that you provide, but no one is coming into your e-commerce store. Potential Problem: poor community development on social media
2) People enter your online store, but few add anything to their shopping cart. Potential problem: you may not be giving your customers enough information about your products for them to feel that they understand your product and then are comfortable enough to complete the purchase.
3) Those who add items to their basket fail to complete the purchase. Potential problem: there are too many steps to complete the purchase or the process is confusing
4) Those who do buy your products don’t repeat their purchase. Potential problem: a gap between expectations of the product and what they received
5) Repeat purchasers fail to bring in more customers.Potential problem: no community feeling generated within your online brand as well as no incentive for them to advocate for your brand.
Methods of Removing Bottlenecks from your Conversion Funnel through Social Media
1) Brand awareness for your online store starts with social media. Here, you’ll want to create a community feeling around your product. You’ll also want to determine which social networks your customers use most frequently and what is the best way of getting into contact with them. Reach out to your audience and provide them with content that is related to the products you sell or services that you provide. Interesting or informative content should make up at least 80% of the content that you produce. This will help grow your brand’s public awareness without seeming too sales-y. The worst thing that you could do is start with advertisements out of the gate. This approach would repel your potential customers
2) Your customers’ consideration to purchase is enhanced by the amount of information that you provide on your website. Remember that your customers will not be able to touch, smell, feel, or try on any of your online products. They are completely limited to the amount of information you provide them. Knowing this, you should make sure that your provide them with all of the information that they could possibly need to make the purchasing decision – things like high quality images, numerous and credible product reviews, quality ratings, etc.
3) The checkout conversion rate is affected by the usability of your site’s checkout process. Make sure that this process contains as few steps as possible, does not require users to re-input information, and is completely linear, so that users do not have to repeat steps or go back
4) Loyalty starts with reaching out to your current customers, those who have purchased from you before. You must contact them to understand if they are satisfied with their purchase and if their purchase matched or exceeded their expectations. Following up will give you an opportunity to up-sell or cross-sell items that they may also need. Also, if the products that you sell have a natural expiration date or will normally be completely used and worn out at a certain point, be sure to understand when that point is and contact your customers with a suggestion of re-purchasing that item or a similar item.
5) Customer advocacy increases when you facilitate it. Encourage your satisfied customers to share their feelings on social media and share part of the profits that they generate with them. Your best customers can quickly turn into your best advocates, helping you to increase your revenues.
Tools to help along the way.
WordPress
WordPress – the easiest content management system for creating a blog is WordPress. A blog should be one of your core advocacy outlets, allowing you to form the exact message that you want to go to your clients. The best thing about it is that it’s absolutely free.Download it here:https://wordpress.org/
Google Analytics
Google Analytics – Google Analytics is a powerful tool that helps you, among other things, track your customers’ movements on your site. You’ll be able to see where they come from and set up a check out funnel to google. Google analytics will also allow you to track your conversions that come through paid advertising on Google.Access Google Analytics here: http://www.google.com/analytics/
Get Social
GetSocial – I would recommend that you use GetSocial’s Social Sharing & Analytics tools. GetSocial’s Social Sharing & Analytical tools allow you to track both social sharing, through social networks, and dark sharing, which is the type of sharing through the copying and pasting of URLs. From there, you can see the true ROI of social media as their software tracks how many leads, visits, page views, and conversions each social and dark share creates. GetSocial gives a lot more detailed information than Google Analytics, giving you the shares and leads breakdown per page, and when combined with your user database, you can pinpoint exactly who is sharing, creating leads, and converting. If you have WordPress or Shopify, it’s even easier as they offer a no-code installation for most of their apps.Check them out here: https://wordpress.org/plugins/wp-share-buttons-analytics-by-getsocial
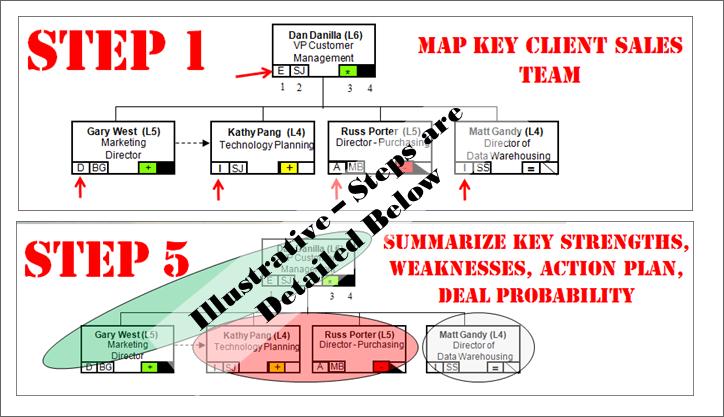
How to Win Key Strategic Sales Deals through Client Relationship Analysis, Management and Improvement – in 5 Easy Steps !
Illustrative of the 5 Step to Power Mapping (Ilustrative – Covered Below}
Analysis and Management of the key decision makers and influencers in any strategic and long-term sale is crucial for success and for obtaining that BIG SALES CONTRACT WIN. This type of analysis of multi-million dollar & strategic sales deals is a common practice of the top revenue generating firms throughout the world including Accenture, IBM, PricewatehouseCoopers, McKinsey, General Electric, Deliotte, KPMG, etc. Through this proven sales analysis technique called Sales Influencer Mapping or Power mapping, you can quickly ascertain the following:
How likely you are to win the deal based on the status of your relationships with the various client company team members?
Who at your client company are for or against you and your firm winning this sale?
Who from your client company has a pre-existing positive or negative perception of your company?
What is the nature of your relationship with all of the key decision makers and influencers that must approve and/or condone this sale to your firm?
{Click on Chart for a larger/clearer image}:
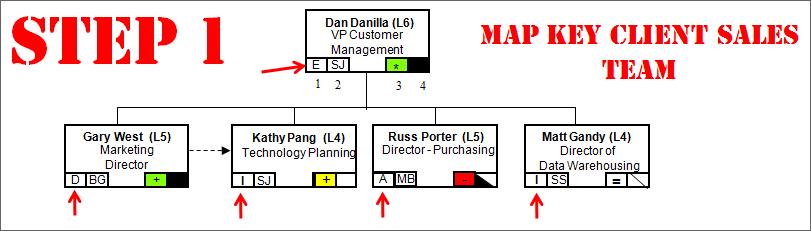
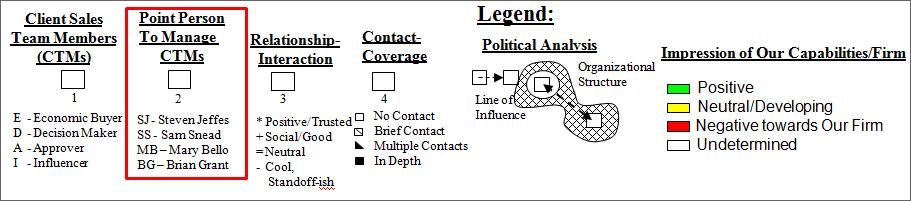
Step #1 – Map Key Client Sales Team
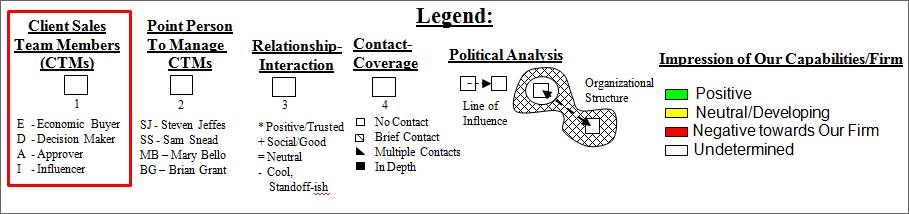
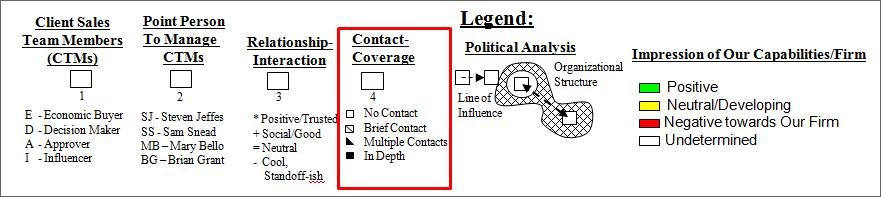
Step #1 Legend
Directly related to the last bullet (#4) above, the first and key step to influencer mapping for longer-term strategic sales is determining the sales influencer landscape as follows:
Who is the economic buyer(s) that has an allocated budget for the item you are selling and who will ultimately make the final decision for the sale? It is the economic buyer’s budget that will fund your sale of your product/service.
Who are the decision maker(s) who the economic buyer must get to concur (sign-off) that they are selecting the right firm, solution, products for this sale? Decision makers are the people who are putting their reputations and careers on the line for selecting you and your firm for this sale.
Who are the key influencer(s) that will influence the opinions and impressions of your company with both the economic buyer and the decision makers? It is the key influencer(s) who can help or hurt the chances of your sale with the economic buyer(s) and the decision makers.
Take Chart #1 below that represents a strategic sale of over $1.2MM to a potential pharmaceutical client. Our strategic sales team consisted of four of us attempting to sell a strategic roadmap for our client to enable an enhanced direct to consumer (DTC) pharmaceutical marketing model.
{Click on Chart for a larger/clearer image}:
Step #1 – Map Key Client Sales Team
Step #1 Legend
In step one, we carefully analyzed the client company organization and quickly determined that Dan Danilla, as VP of Customer Management, was the Economic Buyer for this sale and had adequate allocated budget to actually buy our services. You will notice the “E” noted below his name in box #1 for Economic buyer per the above power mapping legend.
Gary West was determined to be responsible for the project’s delivery and success, so he was labeled at the Decision Maker “D” in box #1 below his name/organizational box.
Russ Porter was determined as being one of the signatories of the contract, so he is marked with an “A” for being a contract Approver in box #1 below his name/organizational box.
Lastly, since Matt Gandy has a great social relationship with both Dan Danilla (Economic Buyer) and Gary West and is often called for professional advice by both, we marked him as a key influencer for this sales deal with an “I” in box #1 below his name/organizational box.
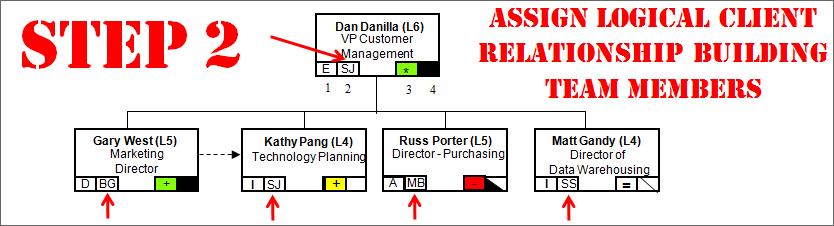
Chart #2 represents Step #2 in Sales Power Mapping {Click on Chart for a larger/clearer image}::
Step #2 – Assign Logical Client Relationship Building Team Members
Power Mapping Step #2 Legend
In this step we assign our company team members to effectively manage the key influencer client relationships based on personality matching and previous interaction history.
In the above example, I (Steven Jeffes-SJ) was assigned to cover Dan Danilla (Economic Buyer) as I have had very good previous interactions with him and he seemed to like my ideas/insights.
Likewise Brian Grant (BG) was assigned to Gary West (Decision Maker), Me assigned also to Kathy Pang (Influencer), Mary Bello (MB) to Russ Porter (Approver) and Sam Snead (SS) to Matt Gandy as they head out for drinks together occasionally and have a budding social relationship.
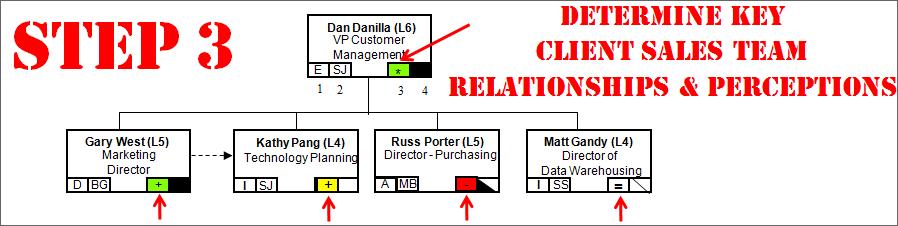
Chart #3 represents Step #3 in Sales Power Mapping {Click on Chart for a larger/clearer image}::
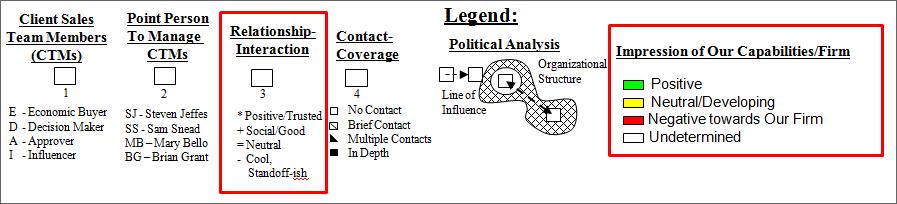
In this step we accomplish two bits of sales analysis as follows:
1)We determine what our previous interaction with each person has been like and how have they reacted to our team members in the past (on average). This is represented by box #3 above “Relationship Interaction”. In box 3 for each client team member, we noted “*” for having a positive/trusted relationship with Dan Danilla, a “+” for having a good relationship with Gary West, a “+” also for Kathy Pang as she has a good relationship with Steve Jeffes, and “-“ with Russ Porter as he has been cool and stand-offish with team members and a “=” with Matt Gandy as he has been neutral in our previous interactions with him.
2)Our second step in this phase is to determine what each person’s impressions are of our Firm’s capabilities based on any previous statements. We color the same box #3 with colors Green for Positive, Yellow for Neutral, Red for the person having negative impressions of our firm. These colors are noted above in box #3 for each client team member – Dan Danilla (Green), Gary West (Green), Kathy Pang (Yellow), Russ Porter (Red), and Matt Gandy (White for undetermined).
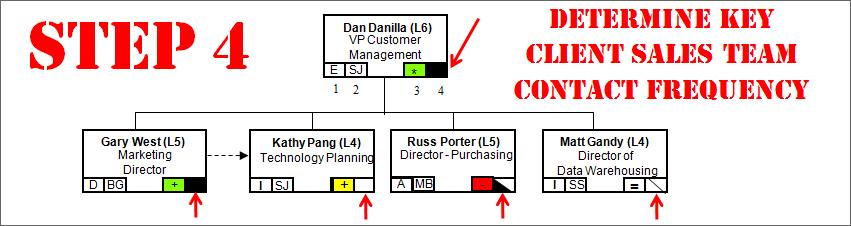
Chart #4 represents Step #4 in Sales Power Mapping {Click on Chart for a larger/clearer image}::
Step #4 – Determine Key Client Sales Team Contact Frequency
Power Mapping Step #4 – Legend
In this fourth step we accomplish the following:
Determine the extent to which we have had contact with each client sales team member. This step is critically important in order to be able to develop an effective action plan to help develop better relationships with each client team member. In addition to noting the frequency of contact, detailed notes must be cultivated from each strategic sales team member to determine the following for each client team member:
1)What previous concerns has the client team member mentioned when dealing with our team or when our potential solution was presented?
2)What previous likes or preferences has the client team member mentioned when dealing with our team or when our potential solution was presented?
3)What type of personality type is this client team member – analytical, introverted, social, extroverted, etc. (Should also be used in matching team members in step #2 above)
4)What checkpoints or process steps is this client team member looking to ‘check off’ as part of this product/solution evaluation?
5)Are there any other team stakeholders missing in developing the above organization chart that should now be added?
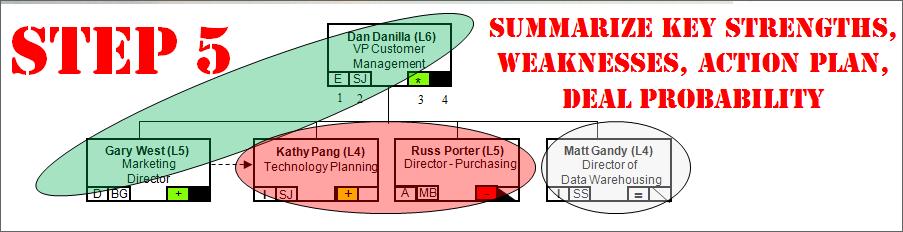
In the fifth and final step of this process, we perform the following:
A)Aggregate and summarize the above sales analysis including deal strengths & weaknesses
B)Develop a Sales Action Plan
C)Estimate Deal Probability Closure %
The picture that summarizes the sales analysis can be shown as follows {Click on Chart for a larger/clearer image}::
The summary of our sales analysis (as depicted in Chart #5 above) for this sale deal is as follows:
We have goodand strong relationships with Dan Danilla (Economic Buyer) and Gary West (Decision Maker) putting us in a good position to win the deal.
We have weaker relationships with Kathy Pang (Deal Influencer) and Russ Porter (Deal Approver) and these relationships need to be strengthened via our sales action plan. They also have either neutral or negative impressions of our firm as compared to our competitors.
Matt Gandy (Deal Influencer) has a neutral position in terms of relationships with our team members and impression of our firm’s solutions and capabilities.
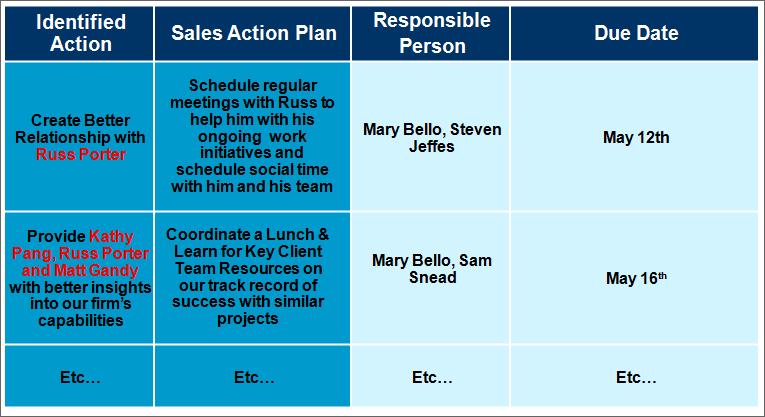
B)Develop a Sales Action Plan (Sample):
The action plan that aligns to our above sales analysis for this sales deal is as follows {Click on Chart for a larger/clearer image}::
Sales Power Mapping – Action Plan
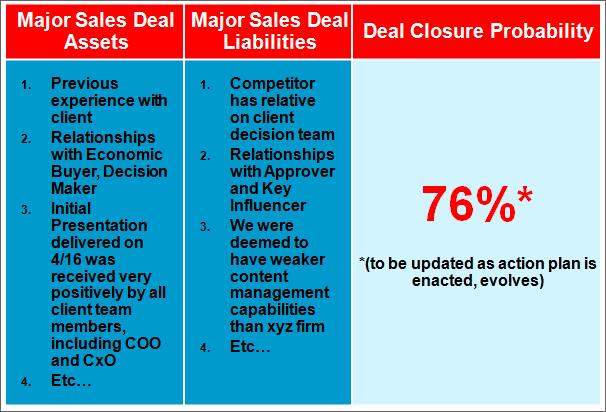
C)Estimate Deal Probability Closure %:
The final step is to estimate, utilizing all of the above insights, as well as major sales deal assets and liabilities, the probability that this sales deal will close favorably (as a win) for our firm as follows {Click on Chart for a larger/clearer image}::
Sales Power Mapping – Sales Deal Summary Assets, Liabilities, Closure Probability %
The bottom line to sales power (influencer) mapping is that the best sales companies and your most formidable competitors are using this level of sales analysis and action planning in order to win that strategic multi-million $$$ deal.
Your organization will be at a competitive disadvantage if you do not employ this level of rigor in your sales pursuits. Trust me, it works and I have closed many large multi-million $$$$ deals (including this one – YES, the above example was A WIN!) using this technique at many of the world’s leading firms.