The 6 Pillars of High-Performance Customer Service Leadership: A Complete Guide to Building Exceptional Teams
July 23, 2026 Leave a comment
Introduction
Customer service leadership has never been more challenging.
Today’s leaders are expected to improve customer satisfaction, increase retention, reduce costs, develop employees, embrace artificial intelligence, and drive operational excellence—all while navigating rapidly changing customer expectations.
Yet despite investments in technology, automation, analytics, and process improvement, many organizations continue to struggle with employee engagement, inconsistent performance, and customer dissatisfaction.
The reason is often surprisingly simple.
Exceptional customer experiences are not created by technology alone. They are created by people.
More specifically, they are created by leaders who understand how to align people, processes, culture, and technology around a common objective: delivering exceptional value to customers. Organizations that consistently outperform their competitors almost always have leadership systems that intentionally develop employees, reinforce accountability, and foster continuous improvement. While technology and artificial intelligence continue to transform customer service, the organizations generating the greatest results recognize that leadership remains the ultimate differentiator. For additional insights into how AI is reshaping customer service operations, read my article, https://bit.ly/4aaFUNy, “The 10 Most Powerful Applications of AI in Customer Service — And the Platforms Actually Leading the Market”.
More specifically, they are created by leaders who establish clear expectations, develop talent, inspire purpose, foster trust, create customer-centric cultures, and continuously challenge their teams to improve.
When Customer Service Teams Struggle
When customer service teams struggle, the root cause is rarely the employees themselves. More often, the issue lies in the leadership systems, coaching practices, culture, and accountability structures that shape daily performance.
After more than two decades leading customer service, customer success, customer experience, CRM, consulting, sales, and operations organizations, I have learned that technology, processes, and organizational structures matter far less than most leaders believe. The highest-performing teams consistently excel in six critical leadership disciplines.
These six pillars form the foundation of a high-performance customer service organization capable of delivering exceptional customer experiences, engaged employees, operational excellence, and sustainable business results.
Effective customer service leadership requires far more than managing operations and service metrics. It requires creating an environment where employees can consistently deliver exceptional experiences while growing professionally and contributing to organizational success.

Pillar 1: Customer Service Leadership Through Performance & Accountability
Performance creates predictability. Accountability creates consistency.
Without clearly defined expectations, even the most talented employees can struggle. Great customer service organizations establish objective performance standards and create a culture where everyone understands what success looks like.
The first step is establishing SMART goals that are specific, measurable, achievable, relevant, and time-bound. Employees should understand not only what is expected of them but also how their performance contributes to broader organizational objectives.
Successful leaders balance operational metrics such as Average Speed of Answer (ASA), Time to Resolution (TTR), First Contact Resolution (FCR), Customer Satisfaction (CSAT), Customer Effort Score (CES), and Net Promoter Score (NPS) with behavioral expectations around teamwork, professionalism, and customer advocacy.

Performance management should never be viewed as a once-a-year event. Instead, it should be reinforced through regular coaching discussions, performance reviews, and ongoing feedback.
One of the most important leadership responsibilities is distinguishing between skill issues and will issues. Skill issues require coaching, training, and development. Will issues require accountability and performance management. Leaders who fail to recognize the difference often apply the wrong solution to the wrong problem.
High-performing teams also develop peer accountability. Team members hold one another accountable for commitments, collaboration, and customer outcomes. Accountability becomes part of the culture rather than something imposed by management.
Leaders must also model accountability themselves. Employees quickly notice whether leaders follow through on commitments, communicate transparently, and hold themselves to the same standards they expect from others.
Leadership Takeaway
Great cultures are not built on good intentions. They are built on clear expectations, objective measures, consistent coaching, and accountability at every level of the organization.
Pillar 2: Customer Service Leadership Through Coaching & Mentoring
Great leaders do more than manage performance, they develop people.
While performance management focuses on today’s results, coaching and mentoring focus on tomorrow’s potential.
Every employee brings a unique combination of strengths, experiences, interests, aspirations, and challenges. Effective leaders invest time in understanding what motivates each team member and where they want to grow professionally.
The best coaching begins with curiosity. Leaders should seek to understand each employee’s career goals, strengths, preferred learning styles, and development opportunities. What motivates one employee may have little impact on another.
Empathy is equally important. Team members face personal and professional challenges that affect performance. Great leaders listen, seek understanding, and demonstrate genuine concern for their employees’ well-being. However, empathy should never replace accountability, and instead, it should enhance the effectiveness of performance conversations.
Individual development plans can be powerful tools for growth. These plans should identify key strengths to leverage, skill gaps to address, and career aspirations to support. Development should be personalized rather than standardized.
Stretch assignments are another critical leadership tool. Employees build confidence and competence when given opportunities to take on new responsibilities, lead projects, participate in cross-functional initiatives, or solve complex customer challenges.

Future leaders are often identified through these opportunities. Organizations that consistently develop internal talent create stronger succession pipelines and higher employee engagement.
The strongest examples of customer service leadership recognize that developing people is not a secondary responsibility—it is one of the primary drivers of long-term organizational performance.
Leadership Takeaway
The greatest legacy of any leader is not what they accomplish personally, but what they help others become.
Pillar 3: Service Leadership Through Motivation & Inspiration
Employees perform at higher levels when they understand why their work matters.
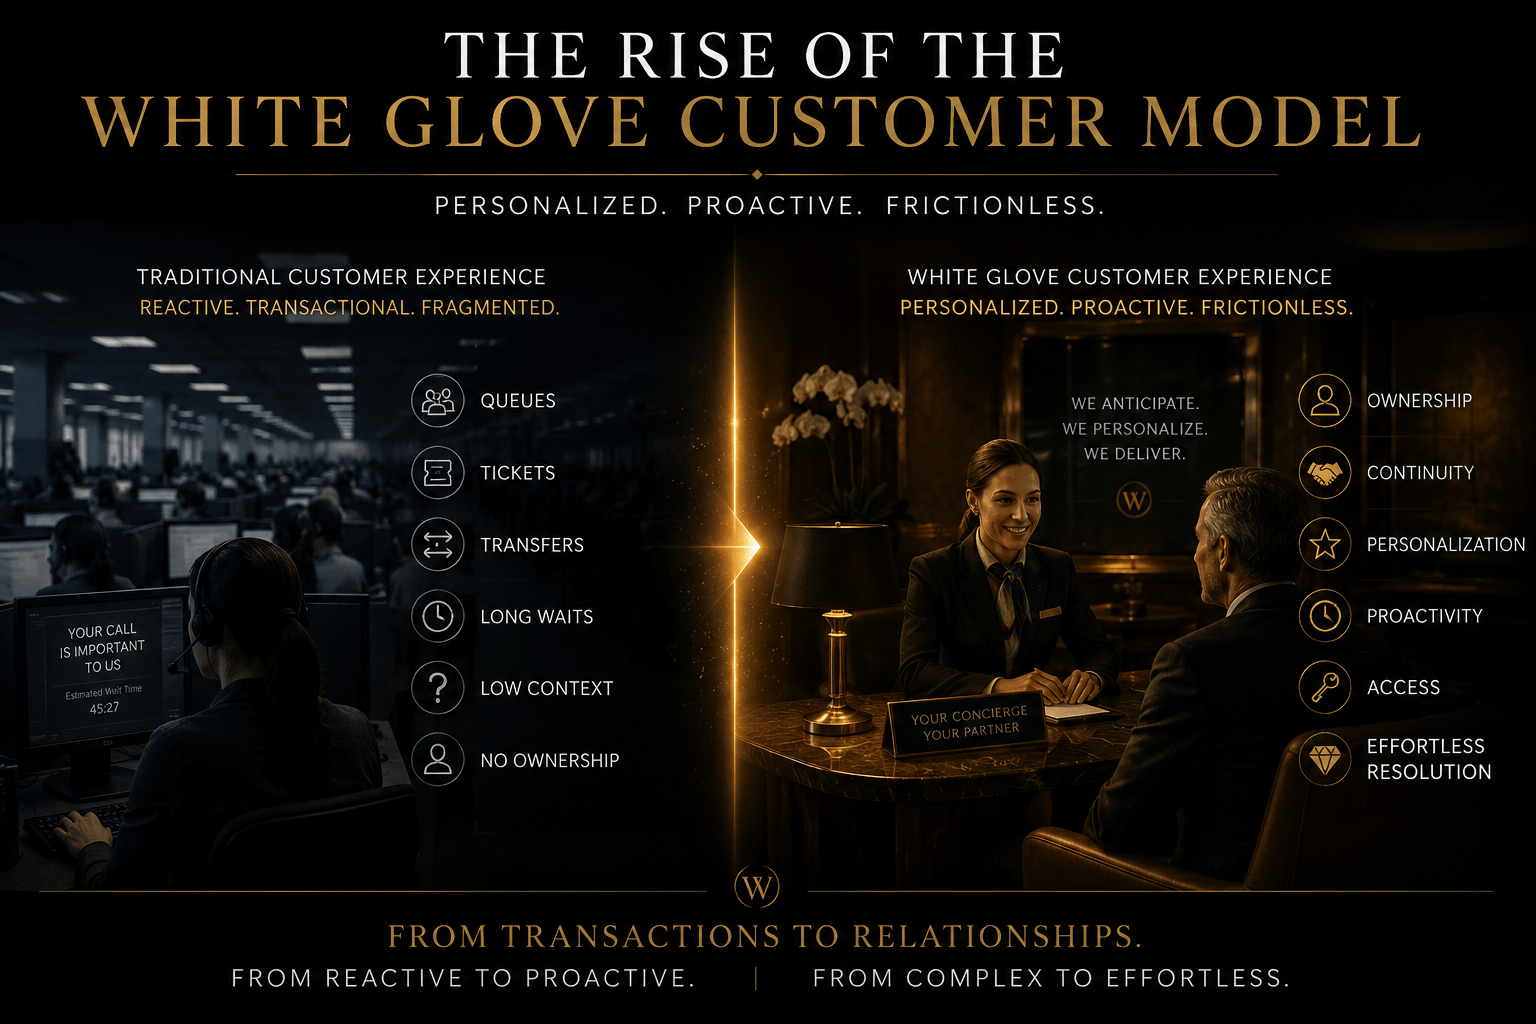
Unfortunately, many customer service teams become disconnected from the larger mission of the organization. Team members see transactions instead of impact. They observe tickets instead of customers. They analyze processes instead of purpose.
I once worked with a customer service organization supporting a medical device company. Despite supporting products that significantly improved patients’ lives, many employees viewed their roles as simply answering calls and resolving issues.
When leadership began sharing patient success stories and connecting daily activities to real human outcomes, employee engagement increased dramatically. Team members began to understand that their work extended far beyond service metrics. They were helping people live healthier, safer, and more productive lives.
Adding on to that, purpose is one of the most powerful motivators available to leaders. Recognition is equally important. Employees want to know their contributions matter. Great leaders celebrate professional accomplishments, personal milestones, certifications, promotions, work anniversaries, and examples of exceptional teamwork

Motivation also increases when employees feel trusted and empowered. Leaders should provide appropriate decision-making authority and encourage ownership of customer outcomes.
Healthy competition can further enhance engagement. Team challenges, performance recognition programs, and collaborative goals can create energy and excitement when implemented thoughtfully.
Leadership Takeaway
Lastly, motivation occurs when employees understand the purpose behind their work, feel valued for their contributions, and believe their efforts make a meaningful difference.
Pillar 4: Customer Service Leadership – Creating a Customer First Culture
Many organizations claim to be customer-centric but fewer actually operate that way.
Customer-first cultures are built intentionally through leadership behaviors, organizational priorities, and daily decision-making.
A customer-first culture begins with a simple question:
“What is best for the customer?”
This last question should influence decisions ranging from process design and policy development to technology investments and employee behaviors.
Therefore, leaders should regularly share customer feedback, success stories, testimonials, and Voice of Customer insights with their teams. Customer comments help employees understand how their actions affect customer experiences.
Additionally, recognition programs should highlight employees who go above and beyond for customers. Whether resolving a difficult issue, saving a customer relationship, or creating a memorable experience, these stories reinforce desired behaviors throughout the organization.
Customer journey mapping can further strengthen customer-centric thinking. When employees understand the entire customer experience—not just the touchpoints they directly support—they make better decisions and identify opportunities for improvement.

Organizations should also treat customer complaints as valuable sources of insight. Complaints often reveal friction points, process failures, communication gaps, and unmet expectations that can drive meaningful improvements.
Leadership Takeaway
Customer-first cultures are not created through mission statements or posters on walls. They are built through daily actions, leadership decisions, and an unwavering commitment to customer success.
Pillar 5: Customer Experience Leadership Through Collaboration & Trust
Show more lines
Trust is the foundation upon which all high-performing teams are built.
Without this trust, accountability feels punitive. Feedback feels personal. Collaboration becomes transactional. Innovation becomes risky.
Trust begins with psychological safety. Employees must feel comfortable sharing ideas, asking questions, admitting mistakes, and expressing concerns without fear of embarrassment or retaliation.
Consequently, research consistently shows that psychological safety is one of the strongest predictors of team effectiveness, collaboration, and innovation. Leaders who create environments where employees can speak openly, share concerns, and challenge assumptions without fear are more likely to build high-performing teams. Readers interested in exploring this concept further may find Harvard Business Review’s seminal article on psychological safety especially valuable: https://hbr.org/2023/02/what-is-psychological-safetyWhat Is Psychological Safety?.
Open communication is essential. Leaders should communicate transparently, provide regular updates, explain decisions, and encourage dialogue. Employees rarely expect leaders to have all the answers, but they do expect honesty.
Also, high-trust teams assume positive intent. Rather than immediately assigning blame, they focus on understanding situations, solving problems, and supporting one another.
Conflict should be addressed quickly and constructively. Healthy disagreement often leads to better decisions, but unresolved conflict can damage relationships and performance.
Successful teams also establish shared operating principles that guide behaviors and expectations. Examples include:
- We communicate openly.
- We support one another.
- We hold each other accountable.
- We assume positive intent.
- We put customers first.
- We solve problems together.
Correspondingly, cross-functional collaboration is another critical component of trust. Customer service rarely operates in isolation. Partnerships with sales, marketing, product, operations, finance, and technology teams are essential to delivering exceptional customer experiences.
Customer service leadership becomes significantly more effective when trust exists between leaders, employees, and cross-functional partners. Without trust, even the best processes and performance systems struggle to achieve their intended results.

Leadership Takeaway
Trust transforms a group of employees into a team. It accelerates performance, strengthens relationships, and enables every other leadership practice discussed in this article.
Pillar 6: Customer Service Leadership Through Innovation & Continuous Improvement
The strongest customer service teams do not simply execute processes efficiently but rather they continually improve them.
This is where great organizations separate themselves from good ones.
Customer expectations evolve. Technology evolves. Competitive pressures evolve. Teams that fail to innovate inevitably fall behind.
Furthermore, one of the most influential continuous improvement philosophies emerged from General Electric’s Work-Out initiative. Its premise was simple yet powerful:
Find a Better Way, Every Day.
The philosophy encouraged employees closest to the work to identify inefficiencies, eliminate bureaucracy, challenge assumptions, and continuously improve processes.
Customer service leaders should adopt a similar mindset.
Encourage teams to ask:
- Why do we do it this way?
- Is there a simpler approach?
- Can we automate this process?
- Can we reduce customer effort?
- Can we improve the employee experience?
- Can we eliminate unnecessary work?
Innovation should become part of everyday operations rather than an annual planning exercise.
Front-line employees often identify the best opportunities for improvement because they interact with customers daily. They see recurring pain points, process breakdowns, communication failures, and inefficiencies long before executives do.
The challenge is creating systems that capture and act upon those ideas.
Unquestionably, many organizations still rely on spreadsheets, email chains, or suggestion boxes to manage innovation. Unfortunately, good ideas often disappear into a black hole.
Leveraging Innovation Management Platforms
Consequently, leading organizations increasingly leverage Innovation Management Platforms to formalize and automate the innovation process.
Examples include:
- Brightidea
- IdeaScale
- Qmarkets
- HYPE Innovation
- ITONICS
- Wazoku
- Planview IdeaPlace
- Ideawake
- Planbox
- InnovationCast
- Viima

Additionally, these platforms help organizations:
- Capture employee ideas
- Launch innovation campaigns
- Facilitate collaboration
- Prioritize initiatives
- Track implementation progress
- Measure business impact
- Manage recognition programs
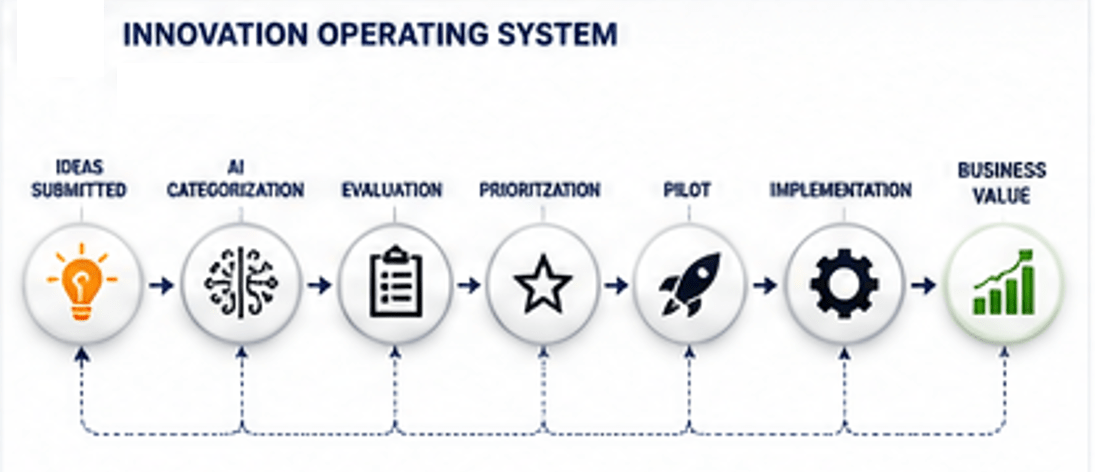
- Leverage AI-assisted idea evaluation and categorization
The result is a repeatable innovation process rather than sporadic brainstorming sessions.
Leaders should also establish structured innovation programs that include:
- Weekly idea submissions
- Monthly innovation reviews
- Quarterly improvement initiatives
- Customer feedback workshops
- Cross-functional innovation sessions
- Continuous improvement councils
Equally important is recognizing innovation. What gets recognized gets repeated.
Consider implementing:
Weekly Innovation Spotlight
Recognize employees who identify:
- Customer experience improvements
- Process enhancements
- Automation opportunities
- Cost-saving initiatives
Quarterly Innovation Awards
Recognize:
- Most impactful implemented idea
- Largest customer satisfaction improvement
- Best productivity improvement
- Most valuable cross-functional innovation
Annual Innovation Excellence Awards
Recognize:
- Innovator of the Year
- Customer Experience Innovation Award
- Continuous Improvement Champion
- Team Innovation Award
Innovation should ultimately connect back to measurable outcomes, including:
- Higher CSAT
- Higher NPS
- Lower CES
- Improved FCR
- Faster TTR
- Increased employee engagement
- Greater productivity
- Reduced cost-to-serve
Leadership Takeaway
Lastly, the best customer service organizations are not those with the smartest leaders. They are the ones that create systems enabling every employee to contribute ideas, challenge the status quo, and continuously improve the business.
Conclusion
Exceptional customer service leadership is not about managing tickets, queues, or service levels alone.
The most successful customer service leadership practices focus on building strong cultures, developing employees, strengthening accountability, and creating sustainable systems for continuous improvement.
Rather, it is about building an environment where people can perform, grow, contribute, collaborate, innovate, and consistently deliver exceptional customer experiences.
The six pillars of high-performance customer service leadership are:
- Managing Performance & Accountability
- Coaching & Mentoring Team Members
- Motivating and Inspiring the Team
- Creating a Customer-First Culture
- Building Collaboration & Mutual Trust
- Driving Innovation & Continuous Improvement
Organizations that master these six disciplines don’t simply create better customer service teams.
They create cultures capable of delivering sustainable competitive advantage through people, purpose, customer obsession, trust, and continuous improvement.

In a world increasingly shaped by automation and artificial intelligence, leadership remains the ultimate differentiator. Technology may enable great customer experiences, but exceptional leaders create the cultures that make them possible.
Therefore, the organizations that thrive in the years ahead will not necessarily be those with the most advanced technology. They will be the ones whose leaders consistently develop people, inspire innovation, and empower teams to deliver extraordinary value to customers every day.

HOW I HELP ORGANIZATIONS BUILD HIGH-PERFORMANCE CUSTOMER SERVICE CULTURES
Understanding the six pillars of customer service leadership is one thing.
Successfully embedding them into an organization’s culture, operating model, leadership practices, and employee experience is something entirely different.
Many organizations struggle not because they lack capable employees, but because they lack the leadership framework, accountability systems, coaching disciplines, customer-centric culture, and continuous improvement processes required to consistently achieve exceptional results.
Over the course of my career, I have helped organizations ranging from startups to Fortune 500 enterprises improve customer service, customer experience, customer success, CRM, sales, operations, employee engagement, organizational effectiveness, and digital transformation initiatives.
My experience includes leadership, consulting, and transformation work supporting organizations such as:
American Express • HP • Verizon • AT&T • Microsoft • Amazon • Hilton • Southwest Airlines • Ritz-Carlton • Pfizer • Toyota • SAP • Macys • Pfizer • Salesforce • Intuit • Cox Automotive • General Mills • INEOS Automotive and many other global brands (see below for full list).
I work with executive teams and customer-facing organizations to:
- Build high-performance customer service cultures
- Improve customer satisfaction, loyalty, and retention
- Develop stronger leadership and management capabilities
- Create effective coaching and mentoring programs
- Design customer-centric operating models
- Improve employee engagement and accountability
- Implement continuous improvement and innovation frameworks
- Transform customer experience into a measurable competitive advantage
- Align AI, technology, and process improvements with business outcomes
Therefore, the objective is straightforward:
Help organizations create stronger employees, stronger leaders, stronger customer relationships, and stronger business results.
ABOUT THE AUTHOR
Steven Jeffes
Managing Director, LegendaryCX
Customer Experience Strategist | Customer Service Executive | Customer Success Leader | CRM & Digital Transformation Consultant | AI & Customer Experience Advisor
🌐 LegendaryCX: https://www.legendarycx.com
🌐 Professional Website: https://www.stevenjeffes.com
📧 Email: stevenjeffes@gmail.com
📞 Phone: (518) 339-5857
Lastly, to learn more about my background, leadership experience, consulting engagements, transformation initiatives, and career accomplishments, visit my professional career profile pages and website portfolio:
- Executive Career Profile
- Career Specialties & Expertise Overview
- Leadership Accomplishments Portfolio
- Selected Clients, Companies & Industry Experience
- Speaking, Consulting & Advisory Services
LET’S START THE CONVERSATION
If your organization is looking to improve customer service performance, leadership effectiveness, customer experience, employee engagement, customer success, operational excellence, or AI-enabled service transformation, I would welcome the opportunity to discuss your goals.
The organizations that outperform their competitors rarely do so because of technology alone. They outperform because they develop exceptional leaders, exceptional cultures, and exceptional customer experiences.
Let’s explore how your organization can do the same.
Steven Jeffes
Managing Director, LegendaryCX
🌐 http://www.legendarycx.com
🌐 http://www.stevenjeffes.com
📧 stevenjeffes@gmail.com
📞 (518) 339-5857
“Building Legendary Customer Experiences Through Exceptional Leadership, Culture, Innovation, and Execution.”