Why Customer Experience Needs a Balance Sheet, Not Another Dashboard
October 14, 2026 Leave a comment
Introducing the Customer Experience Balance Sheet™ Framework
For decades, customer experience measurement has relied on an expanding collection of metrics, dashboards, and reports. Yet many customer experience leaders still struggle to answer a deceptively simple question:
Is customer health actually improving?
Most organizations can tell you their NPS, satisfaction score, service level, or customer effort score. Far fewer can explain whether the customer relationship itself is becoming more valuable or more vulnerable.
The Customer Experience Balance Sheet™ introduces a different approach to customer experience measurement.
Rather than viewing customer experience as a collection of disconnected metrics, it provides a framework for assessing whether customer relationships are appreciating or depreciating in value.
It does this by organizing trust-building factors and friction-producing factors into a single view of customer health.
And it may represent a fundamentally new way to manage Customer Experience and Customer Service.
A Management Framework, Not an Accounting Method
The Customer Experience Balance Sheet™ is not a financial accounting methodology. It is a management framework that uses the familiar language of assets, liabilities, and equity as a practical way to evaluate the health and value of customer relationships.
Just as financial leaders evaluate the interaction of assets and liabilities to understand enterprise value, customer leaders can evaluate the interaction of trust and friction to understand relationship value.
Why Traditional Customer Experience Metrics Fall Short
One of the biggest challenges in customer experience measurement is that many metrics can improve without improving the actual customer experience.
Consider First Contact Resolution (FCR).
Organizations often celebrate rising FCR scores. Yet many issues reported as “resolved” are simply closed, transferred, deferred, or abandoned rather than truly solved. Customers call back, reopen cases, escalate problems, or switch channels to obtain a real resolution.
The organization records success.
The customer records more effort.
This creates a dangerous form of measurement distortion where reported performance improves while customer outcomes remain unchanged, or even deteriorate.
Conceptually, it is similar to focusing on positive results while overlooking the obligations and risks that accompany them.
Many CX metrics measure activity.
Executives need systems that measure outcomes.
The business value of customer-focused decision-making is well documented. According to Forrester research, customer-obsessed organizations reported 41% faster revenue growth, 49% faster profit growth, and 51% better customer retention than organizations that were not customer-obsessed. These findings highlight the importance of understanding not just what customers experience, but whether those experiences are creating long-term relationship value. Business wire on Forrester. https://www.businesswire.com/news/home/20240617295669/en/Forresters-2024-US-Customer-Experience-Index-Brands-CX-Quality-Is-At-An-All-Time-Low
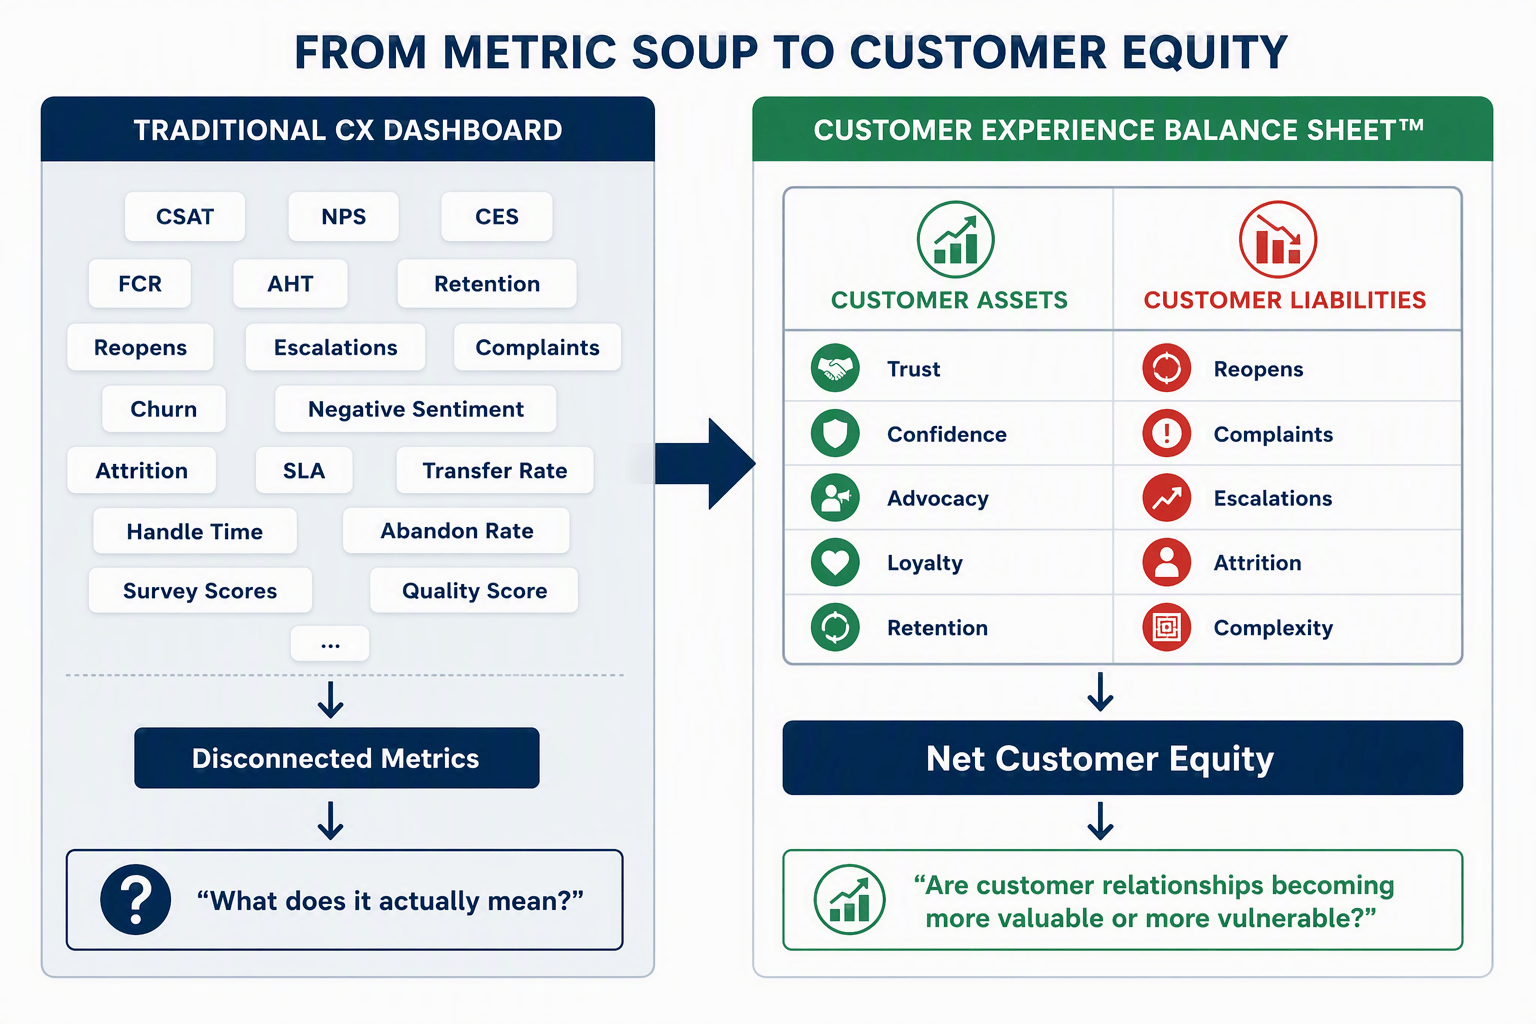
Figure 1. “From Metric Soup to Net Customer Equity“. Traditional CX dashboards often create “metric soup.” The Customer Experience Balance Sheet™ organizes customer assets and liabilities into a framework that produces a meaningful executive indicator: Net Customer Equity.
Introducing the Customer Experience Balance Sheet™
The Customer Experience Balance Sheet™ was designed to address a fundamental customer experience measurement problem by measuring both value creation and value destruction simultaneously.
Like financial leaders who evaluate assets and liabilities to understand enterprise value, customer leaders can evaluate the forces that strengthen and weaken customer relationships.
Customer Assets
Within the Customer Experience Measurement framework, Customer Assets represent the elements that increase customer value and strengthen relationships.
- Trust
- Confidence in the company
- Emotional loyalty
- Willingness to deepen the relationship
- Permission to grow
These assets increase the value of the customer franchise.
Customer Liabilities
Customer Liabilities are operational friction indicators that increase customer effort, reduce confidence, and weaken relationship value:
- Customer effort
- Complexity
- Delays
- Pain points
- Unnecessary obstacles
These liabilities reduce the value customers receive from the relationship.
The Framework and the Metric
The distinction is important.
The Customer Experience Balance Sheet™ is the framework.
Net Customer Equity is the outcome measure produced by the framework.
One provides the structure for evaluating customer relationship health.
The other provides the executive signal that indicates whether customer relationships are becoming stronger or weaker over time.
Net Customer Equity
Net Customer Equity represents the outcome of Customer Experience Measurement when both customer assets and customer liabilities are evaluated together.
Net Customer Equity is the balance between Trust earned and Friction imposed.
In its simplest form:
Trust functions as a customer asset.
Friction functions as a customer liability.
Net Customer Equity reflects their combined effect within the Customer Experience Balance Sheet™ framework.
From Customer Experience Metrics to Customer Equity
Example: When FCR Improves but Customer Equity Declines
A service organization improves First Contact Resolution from 78% to 86%.
Traditional dashboards celebrate the improvement.
However, customer complaints rise, ticket reopens increase, and escalation rates climb.
The dashboard suggests performance is improving.
The Customer Experience Balance Sheet™ tells a different story.
While FCR, a trust-building indicator, improved, customer liabilities increased faster than customer assets.
Net Customer Equity declined.
The organization became more efficient at closing interactions, but not necessarily better at solving customer problems.
Traditional CX scorecards tend to focus on positive outcomes such as satisfaction, loyalty, retention, and advocacy. While valuable, these measures tell only half the story.
The Customer Experience Balance Sheet™ introduces a more balanced view:
A true CX scorecard should track both:
Customer Assets (+)
Metrics that strengthen customer relationships.
Examples:
- Trust
- Advocacy
- Loyalty
- Retention
- Customer Confidence
- Relationship Strength
- Share of Wallet
Measures such as CES and FCR are indicators of customer assets rather than assets themselves. They help quantify the health of trust-building relationships.
Customer Liabilities (-)
Examples:
- Ticket Reopens
- Escalations
- Customer Defection
- Negative Sentiment
- Process Complexity
Metrics that increase friction and erode customer value.
The objective is not simply to improve positive metrics.
The objective is to ensure customer assets grow faster than customer liabilities.
A traditional dashboard reports customer metrics independently.
The Customer Experience Balance Sheet™ organizes those metrics according to whether they build or erode customer value.
The goal is not to create another dashboard.
The goal is to create a management system that reveals whether customer relationships are becoming more valuable or more vulnerable.
Building an Executive Customer Experience Scorecard
The Customer Experience Balance Sheet™ becomes most valuable when applied to a specific business objective. Rather than tracking metrics independently, leaders can organize trust-building and friction-producing indicators around a strategic outcome such as Ease of Doing Business. This approach makes both customer value creation and customer value erosion visible on a single executive scorecard.
Figure 2. “Ease of Doing Business Scorecard“. Example Customer Experience Balance Sheet™ for Ease of Doing Business. Trust-building indicators and friction-producing indicators are evaluated together to calculate Net Customer Equity and reveal whether customer relationship value is increasing or declining.
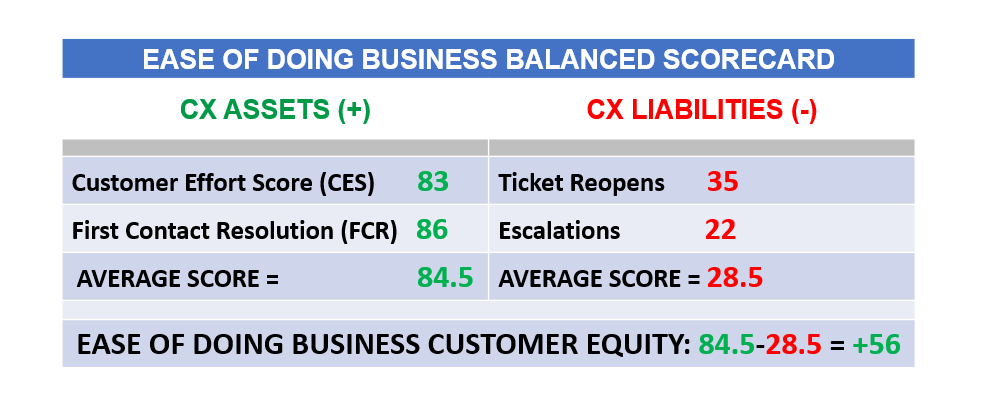
The scorecard below illustrates how a Customer Experience Balance Sheet™ can be constructed around Ease of Doing Business. Trust-building indicators and friction-producing indicators are evaluated together to produce a Net Customer Equity signal that executives can use to assess overall customer relationship health.
Example:
Asset Indicators:
- Customer Effort Score (CES): 83
- First Contact Resolution (FCR): 86
- Average Asset Score: 84.5
Liability Indicators:
- Ticket Reopens: 35
- Escalations: 22
- Average Liability Score: 28.5
Net Customer Equity = 84.5 – 28.5 = +56
This example illustrates how customer experience measurement can move beyond isolated metrics and toward a more balanced assessment of customer relationship value.
The value is not in the arithmetic.
The value is in making both customer value creation and customer value destruction visible on the same executive scorecard.
A traditional dashboard may show improving FCR.
A balanced scorecard reveals whether rising ticket reopens, repeat contacts, and escalations are offsetting those gains.
The result is a more accountable measurement system that rewards genuine outcomes rather than administrative closure.
The Executive Question in Customer Experience Measurement
At this point, most executives ask:
“What does Net Customer Equity actually tell me?”
The answer is simple.
It indicates whether the future value of the customer franchise is appreciating or depreciating.
Relationship quality has measurable economic consequences. Bain research found that Net Promoter leaders typically grow more than twice as fast as their competitors, demonstrating the strong connection between customer loyalty and business performance. https://www.netpromotersystem.com/about/numbers-behind-the-net-promoter-system/
This perspective aligns with broader customer experience research. XM Institute research has found that trust, advocacy, and purchase intent are closely linked to customer experience quality, while Bain’s loyalty research has shown that promoters typically stay longer, buy more, and generate higher lifetime value than detractors. Viewed collectively, these findings suggest that relationship value is governed by more than any single customer metric. Qualtrics article: https://www.qualtrics.com/research/global-roi-cx-2024/ ,
Bain article: https://www.netpromotersystem.com/about/numbers-behind-the-net-promoter-system/
Trust reflects customers’ willingness to continue investing in the relationship.
Friction reflects the burden customers endure to remain in the relationship.
Viewed together, they become leading indicators of future retention, growth, advocacy, and customer lifetime value.
Research from the XM Institute supports this relationship between experience quality and advocacy. Consumers who reported being delighted by an experience were more than ten times more likely to recommend a brand than those who felt upset, highlighting the connection between customer sentiment, trust, and future loyalty behaviors. Qualtrics: https://www.advfn.com/stock-market/NASDAQ/XM/stock-news/88349667/feelings-are-number-one-driver-of-consumer-loyalty
The real breakthrough occurs when Trust and Friction are viewed as a combined executive signal.
The Executive Signal Matrix
Trust and Friction do not operate independently. Their interaction creates four distinct signals about the future health of customer relationships. The Executive Signal Matrix helps leaders identify whether customer relationships are strengthening, weakening, or masking underlying risks before those outcomes appear in traditional business metrics.
Figure 3. The Executive Signal Matrix illustrates how changes in Trust (Customer Assets) and Friction (Customer Liabilities) combine to create four distinct customer equity outcomes and corresponding executive actions. The Executive Signal Matrix also extends the Customer Experience Measurement framework by showing how Trust and Friction interact to influence customer relationship value.
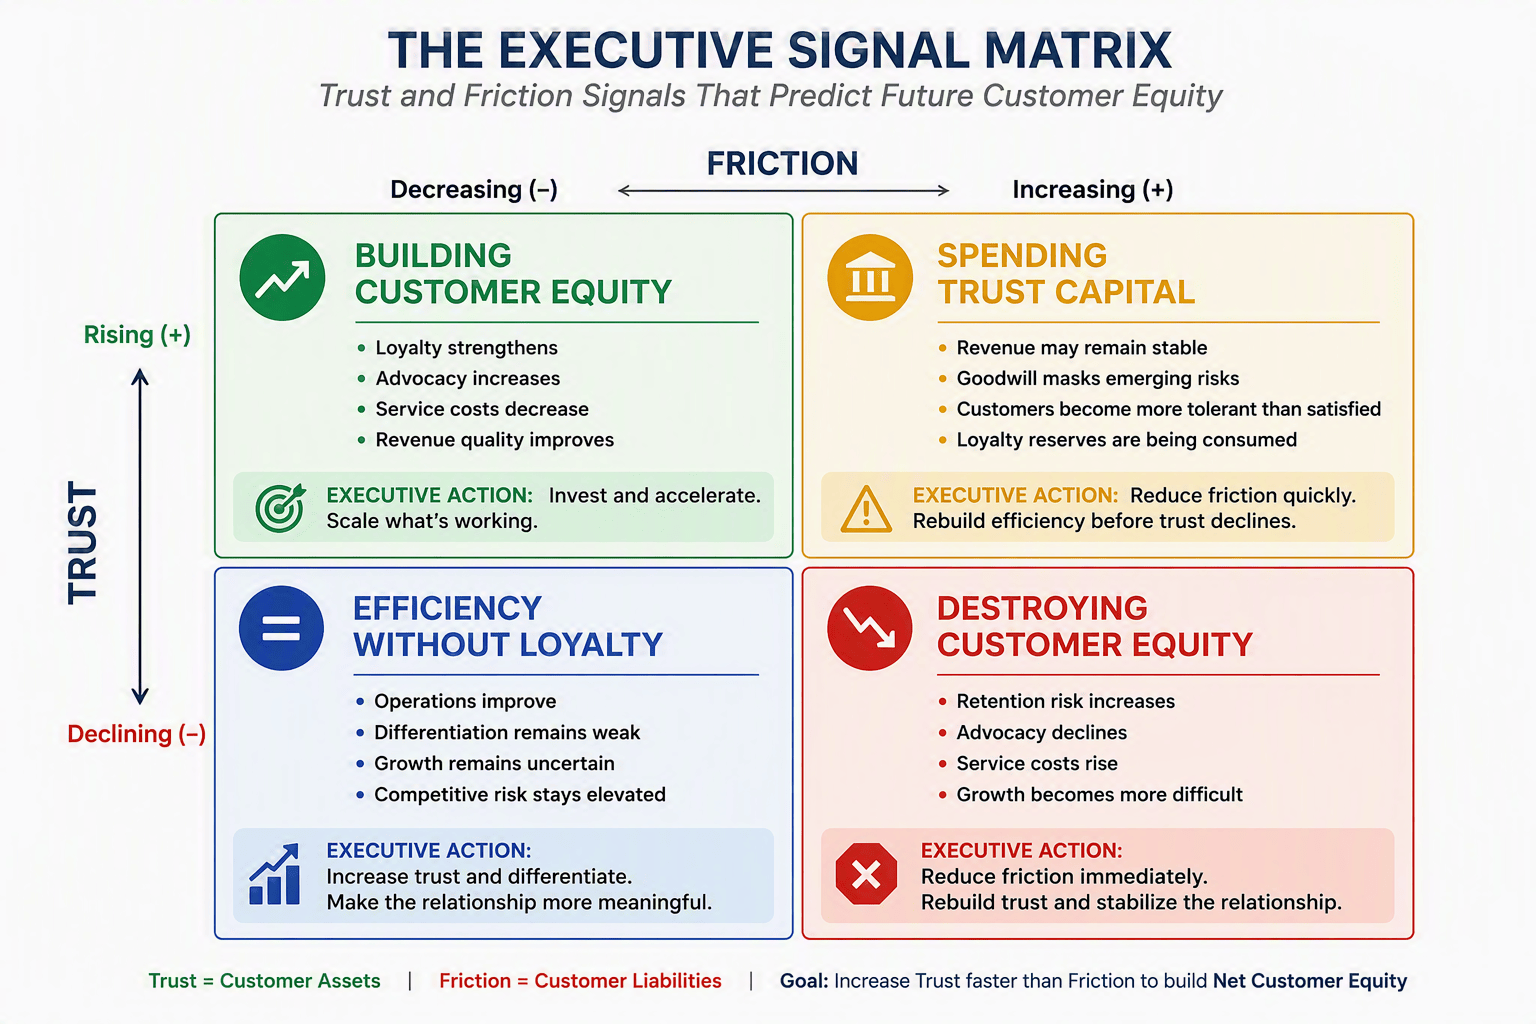
🟢 Building Customer Equity
Trust Rising + Friction Declining
- Loyalty strengthens
- Advocacy increases
- Service costs decrease
- Revenue quality improves
Executive Interpretation:
“We are earning greater permission to grow while simultaneously making it easier for customers to do business with us.”
🟡 Spending Trust Capital
Trust Rising + Friction Rising
- Revenue may remain stable
- Goodwill masks emerging risks
- Customers become more tolerant than satisfied
- Loyalty reserves are being consumed
Executive Interpretation:
“Customers still want to do business with us, but we are spending trust faster than we are earning it.”
This is often the most dangerous warning signal because performance may still appear healthy while customer equity deteriorates beneath the surface.
🟡 Efficiency Without Loyalty
Trust Declining + Friction Declining
- Operations improve
- Differentiation remains weak
- Growth remains uncertain
- Competitive risk stays elevated
Executive Interpretation:
“We are becoming easier to do business with, but not more important to customers.”
🔴 Destroying Customer Equity
Trust Declining + Friction Rising
- Retention risk increases
- Advocacy declines
- Service costs rise
- Growth becomes more difficult
Executive Interpretation:
“We are eroding customer value on both sides of the balance sheet.”
Customer Experience Measurement: Executive Objections
Why not just use NPS?
NPS remains a valuable indicator of customer advocacy. However, no single metric can fully explain the health of a customer relationship. The Customer Experience Balance Sheet™ does not replace NPS. It places advocacy measures alongside trust-building and friction-producing indicators to provide a more complete view of customer relationship value.
How is this different from a traditional Balanced Scorecard?
The framework does not prescribe a single formula. Organizations can begin by identifying trust-building indicators and friction-producing indicators that align with their strategic objectives. Net Customer Equity then becomes a directional indicator of whether customer assets are growing faster than customer liabilities.
Traditional Balanced Scorecards organize measures across multiple business dimensions such as finance, operations, customers, and learning. The Customer Experience Balance Sheet™ focuses specifically on customer relationship value by organizing measures according to whether they create customer assets or create customer liabilities.
How is Net Customer Equity calculated?
Preventing “CX Book Cooking”
Financial accounting evolved because investors needed protection from incomplete reporting.
Customer experience faces a similar challenge. Organizations can selectively highlight positive metrics while minimizing visibility into the friction customers still experience.
High satisfaction scores may coexist with escalations.
Strong FCR may coexist with repeat contacts.
Improving service levels may coexist with declining trust.
The Customer Experience Balance Sheet™ addresses this issue by placing customer assets and liabilities on the same scorecard.
Using the balance sheet as a management metaphor, customer leaders can evaluate both value creation and value destruction together rather than highlighting only favorable metrics.
It creates a more transparent and accountable system for measuring customer health.
The New Executive Scorecard
Financial leaders monitor assets and liabilities to understand enterprise value.
The objective is not to improve individual CX metrics.
Customer leaders should monitor Trust and Friction to understand Net Customer Equity.
The objective is to increase Net Customer Equity.
Because customer experience is not fundamentally a satisfaction system.
It is a value creation system.
And Net Customer Equity may be the first executive metric designed to answer the question that matters most:
Are our customer relationships creating value faster than we are destroying it?
Getting Started
Organizations do not need new data systems to improve customer experience measurement using the Customer Experience Balance Sheet™.
Most already track measures such as customer satisfaction, retention, customer effort, escalations, reopens, complaints, and attrition. The first step is to categorize existing measures as either trust-building indicators or friction-producing indicators. Leaders can then align those indicators to a strategic objective, establish baseline scores, and begin monitoring changes in Net Customer Equity over time.
The goal is not to create more metrics.
The goal is to create a clearer signal.
Selected References
- Forrester Research. Customer Experience Index (CX Index™). Research linking customer experience quality, loyalty measures, and revenue outcomes. https://www.forrester.com/research/cx-index/
- Bain & Company. The Economics of Loyalty and Net Promoter System® Research. Research on loyalty economics, customer lifetime value, advocacy, and growth. https://www.bain.com/insights/the-economics-of-loyalty , https://www.netpromotersystem.com/about/numbers-behind-the-net-promoter-system/
- Qualtrics XM Institute. ROI of Customer Experience and Consumer Satisfaction and Loyalty Research. Research examining the relationship between satisfaction, trust, advocacy, recommendation behavior, and future spending intent. https://www.qualtrics.com/research/global-roi-cx-2024/ , https://www.qualtrics.com/research/global-satisfaction-loyalty-2025/
Ready to Measure Customer Experience Differently?
Most organizations can tell you how customers scored the experience.
Far fewer can explain whether customer relationships are becoming more valuable or more vulnerable.
Want to know whether your customer franchise is appreciating or depreciating?
Let’s assess your Customer Equity scorecard.
Whether you’re evaluating customer health, redesigning your CX measurement strategy, improving operational accountability, or building executive-level scorecards, I help organizations identify the trust-building and friction-producing forces shaping customer value.
Learn More:
Contact
📧 Steven Jeffes
✉ stevenjeffes@gmail.com
📞 518-339-5857
🌐 CX Thought Leadership Articles – http://stevenjeffes.com/
🌐 Customer Experience Consulting & Advisory Services – https://www.legendarycx.com/
Elevating Customer Service and Experience into Competitive Advantage™
🌐 LinkedIn – https://www.linkedin.com/in/stevenjeffes