Achieving Market Leadership by Effectively Managing Customer Loyalty and Advocacy


  • Do you know which of your customers is destroying your company and brand value via negative word-of-mouth comments?
  • Do you know which of your customers is on the verge on defecting from your company and brands to one of your competitors?
  • Do you know which of your customers is promoting your company and brands and generating positive company and brand value on your behalf?
  • Do you know which of your customers is as passionate about your company and brand as your CxOs and should be rewarded as such?


To find out the answer to these questions, read the rest of this informative blog article below.

Customer Loyalty & Advocacy

     Customer Loyalty & Advocacy

{Click on image above for a larger/clearer view}

Your customer base is almost always represented by the above spectrum of customers. What varies from business to business is the percentage in each segment group. The more well managed your business, the more skewed to the right your customers tend to be. Therefore a business must develop strategies to migrate customers continually from the left to the right from segment group to segment group in increasing numbers. The rest of this blog is dedicated to sharing best practices on how to migrate more of your customers to the right of the spectrum.

Customer Loyalty and Advocacy Framework

    Customer Loyalty and Advocacy Framework

{Click on image above for a larger/clearer view}

For any company to achieve world-class status, one must carefully map out a customer loyalty and advocacy framework including the following component steps from the chart above:

  1. Clearly articulated customer segment definitions based on customer satisfaction levels, in addition to customer buy/sell segment definitions (top independent seller, high volume digital seller, etc.)                                                     
  2. A clear customer segment strategy and detailed tactics on the customer treatment that should be employed for each customer satisfaction segment               
  3. Customer cross-segment best practices and processes to drive segment migrations from the far most left segment to the far most right segment (i.e. from dissenters to super advocates)
Customer Loyalty & Advocacy Framework Segments

   Customer Loyalty & Advocacy Framework Segments

{Click on image above for a larger/clearer view}

The above customer loyalty & advocacy framework includes the following segments:

  • Customer Brand Dissenters or Malcontents – Very negative and detrimental to the company’s brand(s)
  • Customer Company Defectors – Very likely to defect to a competitor
  • Customer Neutral or Indifferent – Neither brand supporters or detractors of the company’s brand(s)
  • Customer Brand Supporters – Slightly positive about the company’s brand(s)
  • Customer Brand Advocates – Very positive and generating positive value to the company brand image
  • Customer Brand Super Advocates or Delighted Customers – Active promoters of the company’s brands, adding continuous & tremendous value to the company brand image

A formal social and company/brand listening and tracking program is a best practice on how to identify which of your customers exist in each of the above segments (see my previous blog entry on the topic of Social listening programs).

Customer Dissenters & Defectors

Customer Dissenters & Defectors

{Click on image above for a larger/clearer view}

From this graphic above, we can see clearly that the strategy should be as follows:

  • Dissenters: Diffuse and redirect customer angst and anger and come to some sort of closure agreement on for the source of their angst/anger.
  • Defectors: Get the defectors to see the entire spectrum of value the company has to offer and get them back to the level of positive company engagement vs. disenfranchisement. Provide insights to how a more positive company relationship would reward them – loyalty programs and other rewards.

Unless the individuals in these segments are high value or high profitability customers, then you would want to minimize the financial rewards to these customer satisfaction segments.

In addition and based on my research and experience, you are wasting your marketing and sales $$ spend to these two segments as they are much more unlikely to respond to any marketing offers due to being so currently dissatisfied with the company and brands (think about it – why would they trust you and buy more of the same when their initial experiences were so terrible?). 

Customer Neutrals & Supporters

  Customer Neutrals & Supporters

{Click on image above for a larger/clearer view}

From this graphic above, we can see clearly that the strategy should be as follows:

  • Neutrals: Develop strategies to more of these customers to a net positive relationship by communicating more frequently and effectively with this segment group. The path toward becoming a company/brand supporter should be clearly and frequently communicated to these customers so that they are encouraged to become ever more value to the company and its brands. This group is likely to be lukewarm to your sales and marketing efforts so expenditures here should be highly selective. 
  • Supporters: Develop these supporters into more loyal and more committed customers by developing brand ‘stickiness’ through company loyalty rewards, referral programs, by making it easy (discounts) to buy additional company brands or products, etc. The path toward becoming a company/brand advocate should be clearly and frequently communicated so that these customers become ever more value to the company and its brands. You should have formal programs in place that amplifies their support of your company and brands via social media, forums, etc. 


Customers in these segments should be offered tiered financial rewards to incentivize them to want to contribute at even higher levels to brand value and to remain even more loyal to the company and its brands.

Customer Advocates & Super Advocates

 Customer Advocates & Super Advocates

{Click on image above for a larger/clearer view}

From this graphic above, we can see clearly that the strategy should be as follows:


  • Advocates: This group should be provided with an array of rewards and accolades for helping effectively spread the word about the company or value of the company’s brands, especially if the individual customer is of high value, profitability or influence. The path toward becoming a company/brand super-advocate should be clearly and frequently communicated to these customers so that they are encouraged to become ever more value to the company and its brands. You should have formal programs in place that amplifies their advocacy of your company and brands via social media, forums, etc. 
  • Super Advocates: This group should be provided with top tier rewards and accolades for helping effectively spread the word about the company or value of the company’s brands, especially if the individual customer is of high value, profitability or influence. You should have formal programs in place that, not only amplifies their super-advocacy of your company and brands via social media, forums, etc., but also provides significant rewards for helping increase your brand value (i.e. via a “brand ambassador” rewards program). 
Customer Loyalty & Advocacy Cross-Segment Best Practices

Customer Loyalty & Advocacy Cross-Segment Best Practices

{Click on image above for a larger/clearer view}

The graphic above highlights just a few of the cross-segment customer loyalty & advocacy best practices I recommend that companies continually practice to migrate customers from the negative segments that hurt the company’s brand value (dissenters, defectors) to positive segments (advocates and super advocates) that adds incredible value to a company’s brand.


Here are the brands for which I am a Dissenter, Defector, Neutralist, Advocate and Super-Advocate for based on my own personal experience and opinions:


  • Companies and Brands for which I am an official dissenter:
Companies For Which I am Dissenter

Companies For Which I am a Dissenter

{Click on image above for a larger/clearer view}

Sears

Sears

Sears – I received abject customer service back in the late 1980’s and don’t want anything to do with the retailer ever again. I have tried to give them a second chance and continue to have an unsatisfactory experience.  I pledge to never set foot in a Sears store again.

Target

Target

Target – I interviewed for a senior management position at Target a several years ago was treated so poorly that even the HR manager at the time said the treatment of me was ‘questionable’. She then shared with me that she asked upper management “are we really trying to hire the best candidate here?” before she left the company.  I vowed to never shop in Target again and have held true to my word. 

Empire Carpet Today

Empire Carpet Today

Empire Carpet – We had several issues with our carpet installation and follow up customer service.  They are very disorganized, non-customer friendly and do not seem to keep with the volume of sales that they generate.  I will never use this company ever again. We steer people away from this company if asked.

2) Companies and Brands I am likely to Defect from or have defected from and tell everybody about why I am about to leave (or have left) these company & brands:

Companies for which I am a (potential) Defector

Companies for which I am a (potential) Defector

Bank of America

Bank of America

Bank of America – Closed many of the local branches where I live and the abundance of local branches was the reason I opened an account with BOA in the first place. The remaining branches are now crowded and not staffed adequately. This tells me they care more about the bottom line than customer satisfaction.

Marriott

Marriott

Marriott – In my opinion Marriott has lost its way. I used to be a Platinum member at Marriott for many years. Their properties since that time have become worn as compared to their competitors and they seem to not listen well to their customers. An example of this myopia is when they converted the Courtyards to the Bistro concept. Every customer I speak to was disappointed by this change but they went ahead and did it anyway (presumably to save $$ on operations costs).

Frigidaire/Electrolux

Frigidaire/Electrolux

Frigidaire/Electrolux – Our dehumidifier stopped working after only 1 year.  We have been trying to get a credit from them for six months with no end in sight.  The return process is the most customer unfriendly I have ever encountered with no possibility of human interaction. We have been without a dehumidifier for an entire year due to their poor customer service process.

3) Companies and Brands I am Neutral about and don’t really have much to say about them:

Companies For Which I Have Neutral Sentiment
Companies For Which I Have Have Neutral Sentiment

Samsung, Sony, Direct TV, Time Warner Cable, Panasonic, Cuisinart, Hunter Fans, Home Depot, Lowes, Macy’s, Sunoco, US Air, Delta, Tractor Supply, Wal-Mart, McDonalds, Burger King, Chili’s, Pizzeria Uno, American Airlines, Holiday Inn and many more. This category contains the most number of brands due to the distribution across segment group being shaped like a bell curve

4) Companies and Brands I am an Advocate of and share positive stories with anybody who is willing to listen:


Companies For Which I am An Advocate
 Companies For Which I am An Advocate
American Express

American Express

American Express – I have worked with American Express as a consultant on several different strategic projects.  They are an extremely well run organization with some very smart people running the company. I have also been a Platinum card member for many years.  They provide excellent customer service and their fee structure is the only thing keeping me from being a super-advocate. I tell everyone I meet I consider American Express a world-class company.

Southwest Airlines

Southwest Airlines


Southwest Airlines – Southwest is just a great airline and makes the flying experience pleasurable. They are almost always on-time, the employees are friendly (some even humorous) and they try to be reasonable to their customers at every turn. I used to hate Southwest and am now a Southwest lover/advocate.

Hilton Hotels

Hilton Hotels

Hilton Hotels – Did you guess what hotel I become more loyal to after minimizing my Marriott loyalty? Guess no further. Hilton has been on a roll creating new and invigorating hotels and I am now an advocate/loyalist and stay at Hilton Hotels whenever possible.

Dooney & Bourke

Dooney & Bourke

Dooney & Burke – Dooney & Bourke creates high quality, classic and trendy handbags and accessories that last over long periods of time even with heavy usage.  Styles and collections are priced to reflect the consistent durability and attractiveness of this brand. If something goes wrong with their products, they stand behind them through high quality customer service.

5) Companies and Brands I am a Super – Advocate of and go out of my way to tell everyone how wonderful my experience has been with dealing with these companies:


Companies For Which I am a Super Advocate

Companies For Which I am a Super-Advocate


Cox Automotive

  Cox Automotive

Cox Automotive – Cox Automotive has a great company culture consisting of many top automotive brands that includes Kelly Blue Book, Autotrader, Manheim, NextGear, DealSheild to name a few. The company is one of the best places I have ever worked and includes an employee first culture that they actually adhere to and practice. The company is run by a world-class CEO named Sandy Schwartz that has a great vision for the company’s future and is very visible in his support for the employee oriented culture.

Toyota

Toyota

Toyota  – My family has owned Toyota vehicles for many years.  Toyotas are extremely reliable automobiles. I have a Tundra with 132,000 miles on it and have had zero major issues with it. I have such an affinity with my Tundra I have a hard time thinking about trading it in for another vehicle even though it would most definitely be another Toyota.

Ritz Carlton

Ritz Carlton

Ritz-Carlton – I love staying at Ritz-Carlton since the experience each and every time is truly memorable. I also worked as a consultant for Ritz-Carlton to help design the perfect customer experience for guests.  Ritz Carlton’s goal is to create an experience to remember and smile about and they live up to this promise every time.


The amazing (or sad) part about my sentiment rankings of the above companies is that, despite spending millions ($$$) on analytic systems and databases, I am willing to bet that very few, if any, actually were knowledgeable about my sentiment toward their brands prior to my writing this article.

This relates directly to a previous blog entry I developed on why CRM (Customer Relationship Management based on historical analytic insights) is dead and a new CRRM model is now a best practice. In this article I point out how world-class companies now query their customers how they feel about the company and brands on a periodic basis. Like me, many customers would be more than willing to share their sentiment and how they are feeling towards the company and their associated brands. Bottom Line: Analytic models provide minimal understand of true customer sentiment when it is primarily focused on historical purchases, spend, etc.

The Loyalty Program Toolkit: Lessons Learned & Best Practices Enabling Break-Away Competitive Advantage

The content of this blog is a customer loyalty toolkit containing a host of loyalty program development ‘how to knowledge’ including best practices, project plan, business case, pros/cons, customer loyalty definition, customer loyalty benefits, loyalty program communications plan, loyalty program change drivers and loyalty program development lessons learned.

Sample Blog Content

                                                               Sample Blog Content

{Click on image above for a larger/clearer view}

The market is currently saturated with customer loyalty programs that are either marginally effective or that actually represent an inconvenience to the very customers they are trying to retain. If you are even thinking of launching a loyalty program, consider the Ten Commandments of Loyalty Programs listed below.

Ten Commandments of Loyalty Programs:

  1. The rewards of the loyalty program must be so compelling that customers are actually driven to defect from your competitors and organically refer other customers to your program
  2. The rewards from the loyalty program must be so super-simple to redeem, the customer can do it without any unnatural and inconvenient steps: finding their card, remembering their rewards number, etc.
  3. The rewards from the loyalty program maximize customer choice for redemption: Cash back, points with cash payments, merchandise, travel, buy points, donate points, transfer points, etc.
  4. Company employees are empowered to distribute points to customers based on need such as distributing points to make up for a customer service issue or for a customer’s good will toward the company
  5. Top Tier Customer loyalty achievers for each year are recognized in special ways: Meet with company CxOs to get their feedback; special in-person awards ceremonies, extra unannounced super-perks the following year, etc.
  6. The pre-launch company rewards program is designed such that rewards programs rating agencies (Freddie Awards, Flyertalk), pre-determine the program to be top in class prior to launch based on the design concepts, rewards program content, etc. Ongoing reviews ensure top program billing following the program launch
  7. Rewards program acquisition strategy must include conversion of a customer’s competitor points to join your company’s rewards program at the same level as your competitor(s). (a.k.a. a lateral join)
  8. Any loyalty program should not even be considered without first leveraging Advanced Predictive Modeling Techniques (APMTs) to determine an overall program cost estimate. These APMTs tend to be much more responsive and accurate, quickly reflecting the impacts of all available information on the program liability. Without this APMT component, the program must be cost prohibitive and drive your product/services costs up to unsustainable levels.
  9. The loyalty program must enable communications with its members via the member’s communication channel of choice without burdening members will annoying and redundant member information requests. 
  10. The loyalty program should encourage family company loyalty to the extent of top market leaders (USAA insurance for military service members) such that rewards can be transferred to family members, left to family members after death, allow entry at preferred reward program loyalty levels for select family members of top earners, etc.
Loyalty Program Strategic Drivers & Levers

Loyalty Program Strategic Drivers & Levers

Any world-class loyalty programs that I have helped establish and/or evolve at Macy’s, Bank of America, Wells Fargo, Starwood, Marriott, and American Airlines ALL contain (at least, as a common denominator) the above seven (7) strategic levers as part of their loyalty program. 

{Click on image above for a larger/clearer view}

Loyalty Program Levers

Reasons People Leave Companies

Reasons People Leave Companies

 The Relationship Between Customers Treatment & Retention

{Click on image above for a larger/clearer view}

 Benefits of Customer Loyalty

Benefits Of Customer Loyalty

Benefits Of Customer Loyalty

Company Benefits of Customer Loyalty

{Click on image above for a larger/clearer view}

Loyalty Definition

What Is Customer Loyalty

What Is Customer Loyalty

A Good Definition for Customer Loyalty

{Click on image above for a larger/clearer view}

 Change Drivers for Loyalty Programs

Change Drivers For Customer Loyalty Programs

Change Drivers For Customer Loyalty Programs

Drivers (Reasons) for Creating a Customer Loyalty Program

{Click on image above for a larger/clearer view}

Objectives & Desired Behavior Of A Loyalty Program

Objectives & Desired Behavior Of A Loyalty Program

Loyalty Program Corporate Objectives

{Click on image above for a larger/clearer view}

Loyalty Program Approach

                                Loyalty Program Approach

Customer Loyalty Program Approach

{Click on image above for a larger/clearer view}

Positioning The Loyalty Program

Positioning The Loyalty Program

Customer Loyalty Program Requirements Development

{Click on image above for a larger/clearer view}

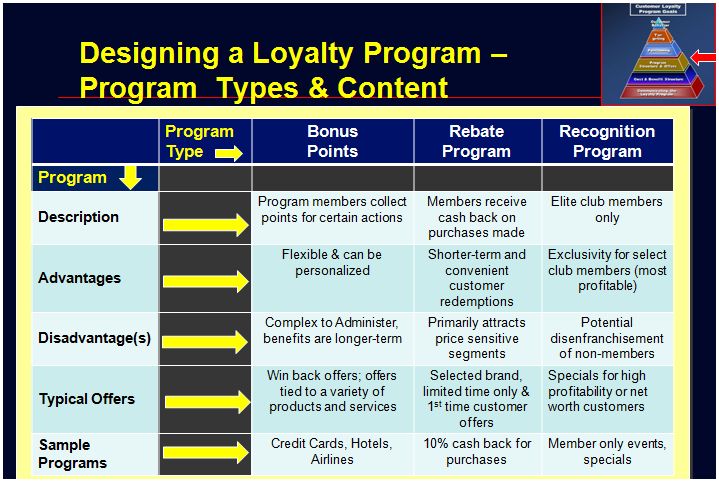
Loyalty Program Type & Content Examples

Loyalty Program Type & Content Examples

{Click on image above for a larger/clearer view}

Loyalty Program - Balancing Benefits With Company Costs

Loyalty Program – Balancing Benefits With Company Costs

Loyalty Program Customer Benefits & Company Costs

{Click on image above for a larger/clearer view}

Loyalty Program Business Case

                            Loyalty Program Business Case

Loyalty Program Business Case and Reward Financial Model

{Click on image above for a larger/clearer view}

Loyalty Program Communications Plan

Loyalty Program Communications Plan

Customer Loyalty Program Communication Plan Structure

{Click on image above for a larger/clearer view}

Loyalty Program Point Collection Simulator

Loyalty Program Point Collection Simulator

Customer Loyalty Program Reward Point Redemption Simulator

{Click on image above for a larger/clearer view}

Loyalty Program Point Redemption Calculator

Loyalty Program Point Redemption Calculator

Loyalty Program Reward Category Point Redemption Volume Estimates

{Click on image above for a larger/clearer view}

Loyalty Program Business Case & Project Plan

Loyalty Program Business Case & Project Plan

Loyalty Program Business Case & Project Plan

{Click on image above for a larger/clearer view}

Loyalty Program Pros and Cons

Loyalty Program Pros and Cons

Customer Loyalty Program Pros & Cons

{Click on image above for a larger/clearer view}

Loyalty Program Lessons Learned - 1 of 3

Loyalty Program Lessons Learned – 1 of 3

Customer Loyalty Program Lessons Learned & Best Practices (1 of 3)

{Click on image above for a larger/clearer view}

Loyalty Program Lessons Learned - 2 of 3

Loyalty Program Lessons Learned – 2 of 3

Customer Loyalty Program Lessons Learned & Best Practices (2 of 3)

{Click on image above for a larger/clearer view}

Loyalty Program Lessons Learned - 3 of 3

Loyalty Program Lessons Learned – 3 of 3

Customer Loyalty Program Lessons Learned & Best Practices (3 of 3)

{Click on image above for a larger/clearer view}


Bottom Line: If you are ever considering implementing a customer loyalty program, please take the above lessons learned and best practices into account as these were all developed after having successfully implemented several of these loyalty programs at Fortune 500 companies across the globe.

Managing Customer Life Stages and Events Can Super-Charge Your Marketing Effectiveness

Why Knowing Your Customer’s ‘Life Stage’ & Associated Events are Crucial to Delivering Effective Marketing

{Click on Chart for a Larger Image}

overview
Life Stage Overview

Customer Life Stage Marketing Can Help You Deliver the Right Promotions with the Right Offers, at the Right Time and Via the Right Channel

Here are some important questions to bring into perspective how important it is to track and recognize your customer’s life-stages and events:

  • Would you forget to celebrate a school graduation for an important relative?
  • Would you forget to celebrate the birthday of a spouse or significant other?
  • Would you forget to recognize the birth of the first child of a couple that is close to you?
  • Would you miss noticing the retirement of a person that is very special to you?

If not, then why would you miss these important milestones for your valuable and long-time customers as these all represent significant and extremely meaningful life-stage events for them?!

A Statement on Life-Stage Marketing to Remember: “Marketing without Considering Your Customer’s Life Stages is Comparable to Marketing to Them With A Blindfold On”

For this reason, your segmentation strategy must take into account an array of customer profile variables including customer life stages. The following chart depicts how customers follow normal life stages and are grouped into life stage segments. As customers evolve to the next life stage segment, their consumer spending evolves and generally increases until they reach the most mature life stages. {Click on Chart for a Larger Image}:

Customer Life Stage Segments

Customer Life Stage Segments

As your customers age and evolve through their normal life-cycles, their customer profile changes along with this evolution including:

1) Needs & Preferences

2) Propensity to spend at higher levels 

3) Desire for higher quality products and services

4) Growing insensitivity to higher product pricing in exchange for premium service

The next chart highlights the significant life stage events that are associated when a customer migrates from one life stage segment to another. These are the life-events you should track and recognize in order to build stronger and more meaningful relationship with your customers. Customers have reported that they feel “appreciated” or “valued” 31% more from companies that take the time to acknowledge a significant life stage event vs. those who do not recognize these events.  {Click on Chart for a Larger Image}:

Customer Life Stage Events

Customer Life Stage Events

How do you obtain insights into the above major customer life events? The simple answer is that you ask them. Customers are very willing to share their preferences and life events since volunteering this information builds the potential for a better relationship with your company. This also demonstrates that, as a company, you care and listen to your customers. 

By using preference and life event subscription portals, world-class companies allow their customers take control of their relationship with your company by self-reporting their contact preferences (preferred topics they want to hear about, maximum frequency of communication, preferred communications channels, exception events that allow you to contact them even when there is a previous “do not contact” preference set,  etc.). These same relationship preference portals also allow customers to report either known or as they occur life stage events (birthdays, anniversaries, expected graduation dates, job promotions, etc.) in exchange for being recognized and appreciated (discounts, upgrades) for supplying this relationship enhancing and sensitive information.

The next chart illustrates how customer’s needs for products and services evolves as they migrate through their natural customer life stages. By offering products and services that are right for the customer’s associated life-stage, companies can experience a much higher offer acceptance rates (8-47%).  {Click on Chart for a Larger Image}:

Types of Products Offered Should VMatch Customers Life Stages

Types of Products Offered Should Match Customers Life Stages

The following chart illustrates how your marketing promotions and offers must be in total alignment with their life-stage segment needs.  {Click on Chart for a Larger Image}:

Marketing & Promotional Offers Should Match Your Customer's Life-Stages

Marketing & Promotional Offers Should Match Your Customer’s Life-Stages

The above two charts depict how both products and offers must be in total alignment with your customer’s life-stage in order to be effective. This ensures products/services and marketing offers are at the right time, with the right content and are at the right time and via the right channel (by collecting and managing life-stage channel preferences). {Click on Chart for a Larger Image}:

Customer Life Stages Segments with Matched Products, Offers, Spend

Customer Life Stages Segments with Matched Products, Offers, Spend

Bottom-line: If you are not taking your customer’s life stages and associated events into your segmentation and marketing strategy, then you are marketing with a blindfold on and not recognizing what is most important or relevant to your customers. A large US bank where I implemented this life stage segmentation schema and associated customer life-stage marketing management program witnessed a 25% increase in customer offer acceptance as well as a 18% increase in overall customer loyalty as measured by the reduction of customer defection rates.

The Importance of the Brand Value Chain (BVC) to Attaining Market Leadership

A High Performing Company with All Value Chain Links Strong (No Brand Value Links Broken or Sub-optimized):

Company Brand Value Chain

How a Broken Value Chain Impacts Your Company

In order for your company to have a chance at being a market leader, it is important for it to have all links in the brand value chain attaining top effectiveness. Just one broken link in this brand value chain (BVC) can bring your whole company down and subject your company to the following risks:

1)      Loss of Market Share as compared to your competitors

2)      Inability to close sales

3)      Lack of marketing leads and inquiries

4)      Declining customer base over time including customer defection to the competition

What is the Brand Value Chain (BVC) you might ask?

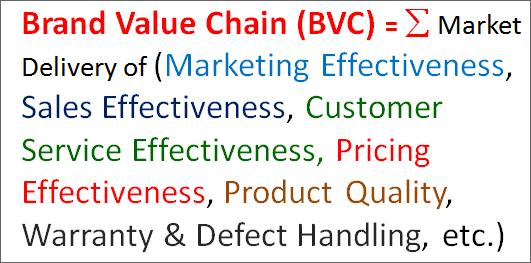
The Brand Value Chain is defined as the effectiveness of the sum of all company functions delivered to your customers and the marketplace: Marketing, Sales, Product/Service Quality, Customer Service, Pricing, Warranties/Returns, Customer Relationship & Experience Quality, etc.

Brand Value Chain Defined

Therefore, when one link of the brand value chain is weak or about to break, the following rule regarding brand image almost always holds true:

Brand Image & Brand Value Chain Rule

Symptoms of a Broken Value Chain:

  1. Your sales team just can’t seem to close the deals. Potential broken value chain links: Poor customer service, product utility/quality, pricing.
  2. You have great products, pricing and customer service but nobody has heard of you. Likely broken value chain links: Poor marketing and/or sales operations.
  3. Your customer base keeps declining year-over-year: Likely broken value chain links: Poor customer service or eroding product quality or pricing.
  4. Your marketing generates a plethora of leads that are not closed or turned into sales deals: Likely broken value chain links: Sales operations and marketing-sales lead management procedures are non-existent or sub-optimized.

Examples Companies with Potential Broken Value Chains:

Every day we see examples of companies that seem to have everything going for them except one weak link in the brand value chain that brings the entire perceived brand value down. Some examples are as follows:

  • Comcast – great programming, great marketing/sales, great products, great technology & infrastructure but perceived bad customer service and pricing creates a negative impression of the company by many customers and prospects – their company’s Achilles heel.
  • Searsgreat products, good pricing, good in-store sales, etc. but is severely lacking in marketing and promotions including in-store and on-line customer experience design which tends to brings down the other great intra-company performers and has led to a decline in the customer base.
  • General Motorsgood pricing, promotions, dealer sales, etc. but perceived increased negative product quality due to the number of recent recalls has brought many questions regarding the GM brand. These questions about product quality could impact customer retention and acquisition in the longer-term.

How the Broken Value Chain Impacts Company Performance:

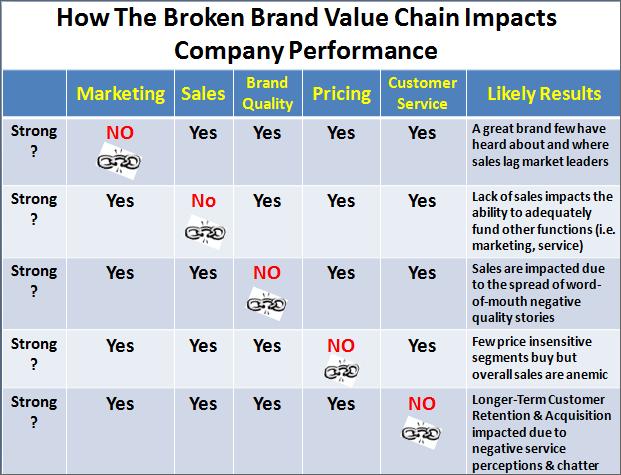
What all of these examples show is that a company must deliver great performances in every category to become a market leader. One broken link in the brand value chain is enough to reduce the company to a market laggard and risks them going out of business over time if not rectified.

The following chart illustrates how one broken brand value chain has the ability to bring down the entire company and risk its overall viability:

Company Impacts of the Broken Brand Value Chain


How to Identify & Rectify a Broken Value Chain:

What steps can you take to identify and then rectify a broken brand value chain (BBVC) you might ask? Here are some easy steps to take to first, identify and then rectify a broken value chain:

Proven Methods to Identify a Broken Value Chain (BVC):


  • Inter-departmental peer reviews – How well do our peer departments think we are performing?
  • External departmental & function benchmark reviews – how well are doing vs. market leading company’s similar function (e.g. sales to sales or marketing to marketing performance comparison)?
  • Customer external scorecard reviews – How well do our customers and prospects think we are performing?


 Methods to Rectify a broken value chain:

  1. Perform Six-Sigma process and effectiveness improvement reviews
  2. Invite customers to participate in focus groups and advisory councils to help identify ways to improve the department’s effectiveness (sales, marketing, customer service, etc.)
  3. Form Improvement “Tiger Teams” consisting of inter-departmental high performers to assist with increasing functional performance.
  4. Invite outside and leading consulting firms to help infuse a holistic set of industry best practices across and within company functions – marketing, sales, customer service, pricing, etc.
  5. Tie performance and variable rewards to customer rated scorecards where company employees only get paid bonuses when our customers rate us as high performing.

Measuring Marketing ROI vs. Measuring Customer Value & Equity

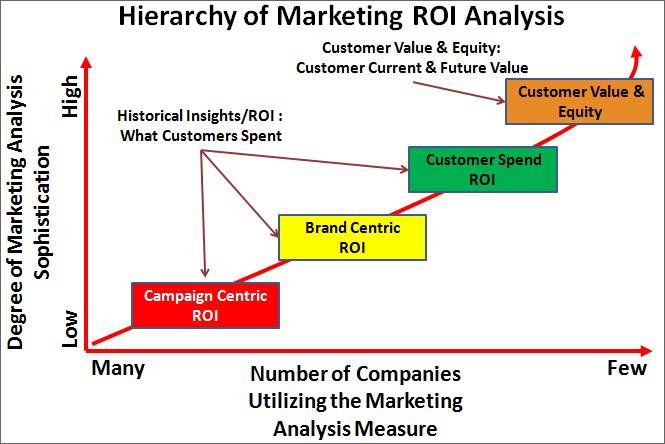
Hierarchy of Marketing ROI Analysis (Levels 1-4)

Hierarchy of Marketing ROI Analysis (Levels 1-4)

In this blog we cover the following topics:

  1. The four (4) levels of sophistication in measuring marketing and customer ROI
  2. The three traditional levels of marketing ROI that focus on spend vs. return
  3. The calculations for measuring campaign ROI, Brand ROI and Customer Spend ROI
  4. Why measuring customer value and equity is a far better measure than traditional marketing ROI
  5. How Customer Value and Equity Covers the Measurement of ALL customer facing activity – marketing, PR, sales, customer service, community relations, etc.
  6. What your company needs to do to increase its sophistication of measuring market and customer insights

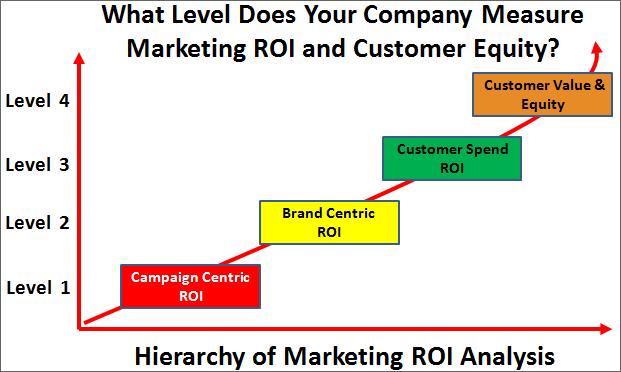
The following chart depicts the capability levels for measuring market ROI and customer value.

Level 1: Campaign centric ROI is the measurement, at a campaign level, of campaign costs vs. campaign return (customer spend vs. campaign return)

Level 2: Brand Centric ROI is the measurement, at a brand level, of brand return for all conducted campaigns (roll up of campaign ROI to a brand level)

Level 3: Customer Spend ROI is the sum of all brand and all brand campaign ROI at a customer level.

Levels of Marketing ROI Measurement (Levels 1-4)

Levels of Marketing ROI Measurement (Levels 1-4)

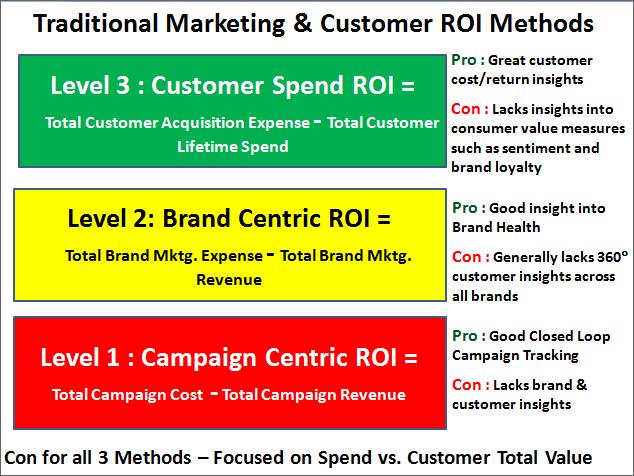
The following chart defines the first three levels of marketing ROI and points out the pros and cons for utilizing each method. The downfall for all three methods, as indicated at the bottom of the chart, is that they rely on historical spend vs. forward looking measures as are found in Level 4 – Customer Value and Equity Measures.

Traditional Marketing & Customer ROI Methods (Levels 1-3)

Traditional Marketing & Customer ROI Methods (Levels 1-3)

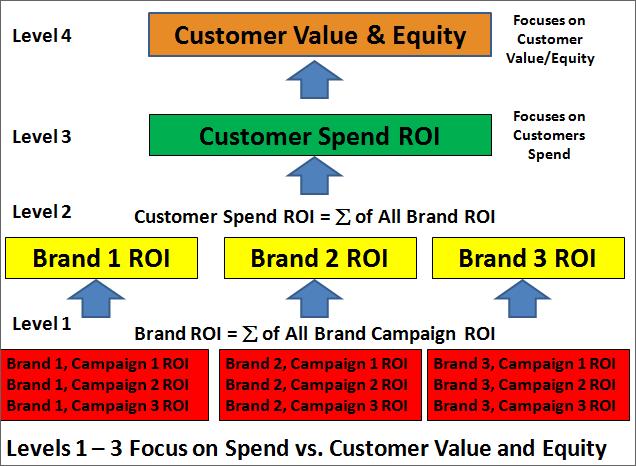
The following chart depicts the calculations for determining campaign level and brand level ROI that, if done correctly, should roll up to a customer level (Level 3 – Customer Spend ROI). The detailed definition of the highest level (Level 4 – Customer Value & Equity) is covered just below in this blog.

Levels 1 – 3 Focus on Spend vs. Customer Value and Equity

Levels 1 – 3 Focus on Spend vs. Customer Value and Equity

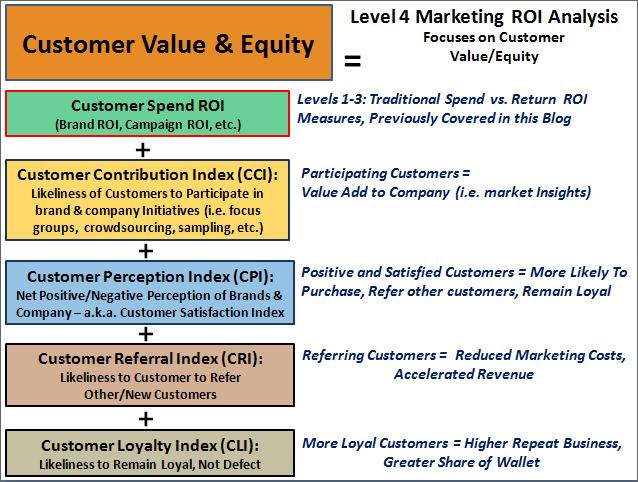
The following chart defines the components of Level 4 ROI analysis – “Customer Value and Equity”.  This level includes the roll-up for Customer Spend ROI, but also includes insights that predict customer future behavior as well as defining how valuable the customer is to the company beyond what they spend.

For example, a customer who is referring 2-3 customers to the company per week, participating in customer focus groups is a far more valuable customer than another customer with equal spend with your company.  

Similar to company stock value, the measurement of customer value and equity is a far more robust way to measure the value of the customer base, how likely they are to remain a loyal customer, etc. 

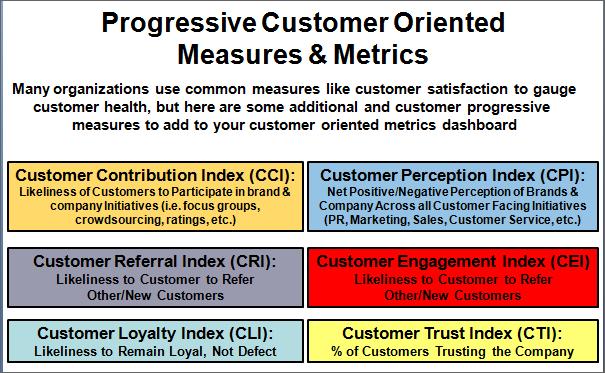
Customer Value & Equity Calculations, as shown below includes several different indices such as Customer Contribution Index (CCI), Customer Perception Index (CPI), Customer Referral Index (CRI) and Customer Loyalty Index (CLI). These indices help determine the overall health of the customer base vs. merely customer spend as is associated with levels 1-3 (spend focused).

Customer Value and equity calculations take into account the level 1-3 spend ROI measures, but utilizes a balanced scorecard approach in that the indices above are weighted against the spend vs. ROI measures. For example, if Brand A has a high ROI but also has a bunch of irate customers unwilling to partner and participate in brand activities, then this is indicative of a brand that, while doing well now, will experience a great deal of future customer churn, negative social comments, brand tarnishing, etc.

Level 4 Marketing ROI Analysis - Customer Value & Equity

Level 4 Marketing ROI Analysis – Customer Value & Equity

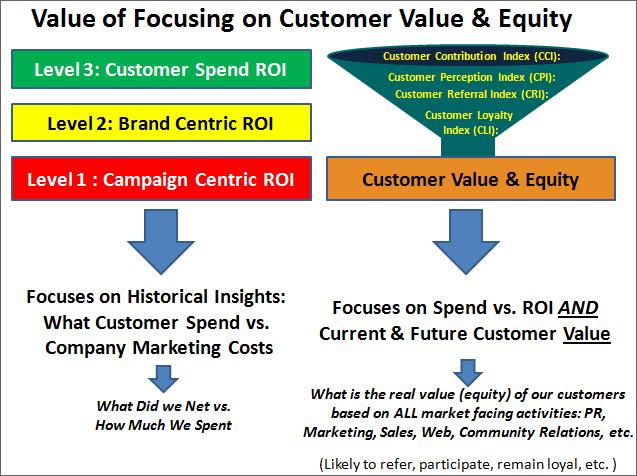
The following chart further defines the difference between focusing on spend ROI analysis vs. focusing on customer value and equity.

Value of Focusing on Customer Value & Equity

Value of Focusing on Customer Value & Equity

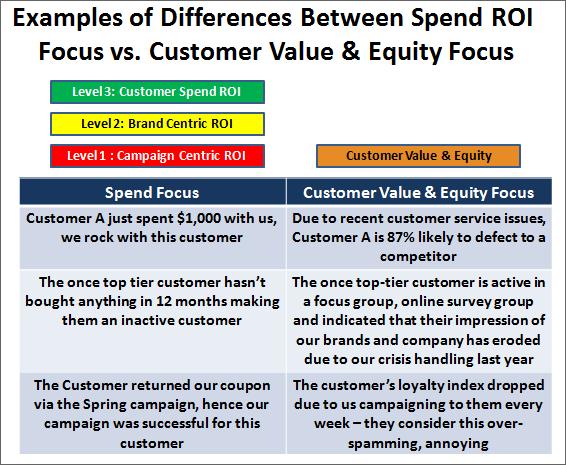
The last chart provides some real examples of the difference between focusing on spend ROI analysis vs. focusing on customer value and equity.

Examples of Differences Between Spend ROI  Focus vs. Customer Value & Equity Focus

Examples of Differences Between Spend ROI
Focus vs. Customer Value & Equity Focus

The bottom line here is that if you are focusing on Level 1-3 ROI calculations, you have a short-term and myopic view of the health and value of your customer base and are missing the strategic and longer-term insights that enable you to determine customer, company and brand future value and earnings.

Any company thinking about acquiring another should perform this robust customer diagnostic to determine if they are inheriting a group of angry/upset customers that will defect after a merger or a set of extremely valuable customers with positive customer equity who will take the stock value of the merged company to the stratosphere.

Contact me to find out how to move past traditional marketing ROI measurement and how to evolve into developing more robust customer value and equity insights for your company.  

Change Management 101 Primer for Senior Executives (CEOs, COOs, CSOs, CMOs, CFOs, CCOs, etc.)

The following blog was written to provide a simple primer on Change Management for Top Executives. It is written so you ‘get it’ in 15 minutes or less of reading this article.

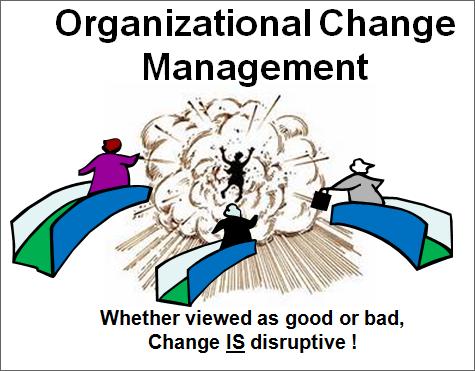
Change IS Disruptive, but Change Management Can Mitigate Impacts to Productivity

Change IS Disruptive, but Change Management Can Mitigate The Impact on Productivity

As a business leader, have you ever encountered the following challenges within your company:?

1. Implemented new technology or IT system and people failed to adopt & fully utilize it?

2. Implemented new processes and ways of doing business and your employees continued to follow the older methods?

3. Your competition continually seems to be evolving and innovating, developing new and more effective ways of doing business, while your company culture resists change and new ways of doing business?

The remainder of this blog is dedicated to sharing some of the techniques to get your organization to embrace and be supportive of change.  These change management techniques are based on my years of implementing change at organizations like Macy’s, American Express, Intuit, AT&T, Pfizer, Bristol-Myers Squibb, Oracle, CBS Interactive, Wells Fargo, and numerous other Fortune 500 companies.


Topics in this blog:

1)      What is Change Management – A Simple Definition

2)      Why is it Important?

3)      Why is change resisted by so many employees?

4)      Do all employees approach change the same way and how do you harness the power of the innovators and change ‘early adopters’?

5)      How Change Management Helps Accelerate Change

6)      Change Management Mitigates the Impact on Productivity while Implementing Change

7)      The Organizational Change Model Facilitates Change Success & Greater Business Results

8)      Steps in the Organizational Change Model Ensure Change Project Success

9)      The Importance of the eight (8) Change Management Steps

10)   Summary – Change Management & Innovation Requires a 360°, holistic approach driven by skilled and experienced change management professionals

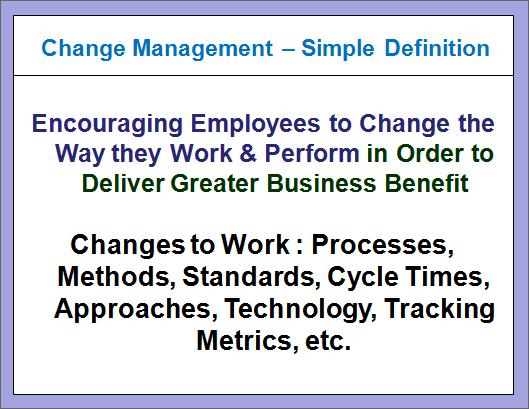
1)    A simple definition of what change management is:

A Simple Definiton for Change Management

A Simple Definiton for Change Management

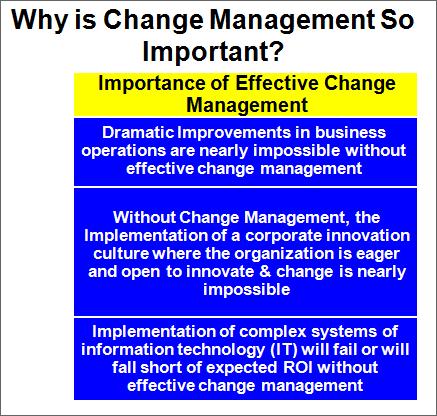
2)    Why is change management so important?

Why Is Change Management So Important?

Why Is Change Management So Important?

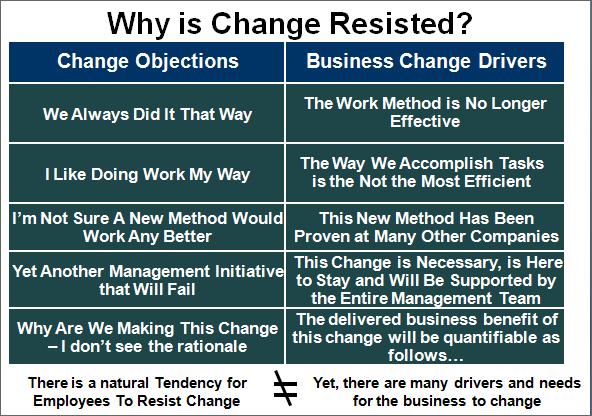
3)    Why is change resisted by many employees?

Why is change resisted by many employees?

Why is change resisted by many employees?

Bottom Line: Without proper education and motivation, change is naturally resisted within the workplace by all but a few.

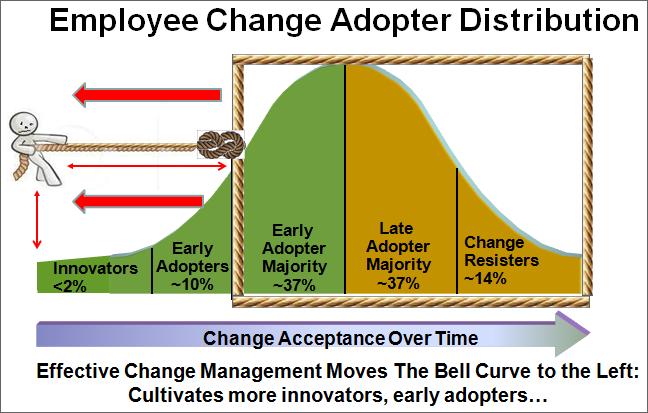
4)    Do all employees approach change the same way?

Employee Change Adopter Curve

Employee Change Adopter Curve

As depicted by the above chart, employees range from ardent resisters to innovators. Change management solicits the support from innovators and early adopters to help diffuse organizational change to the remainder of the organization.   

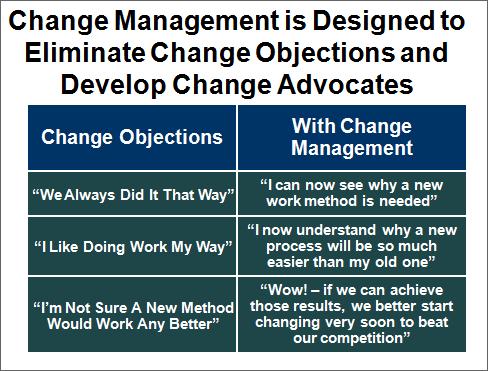
5)    How Change Management Helps Accelerate Change

How Change Management Helps Accelerate Change

How Change Management Helps Accelerate Change

Change management not only removes obstacles to change, it helps develop enthusiasm and excitement for accelerated change in the future. 

6)    Change Management Mitigates the Impact on Productivity While Implementing Change

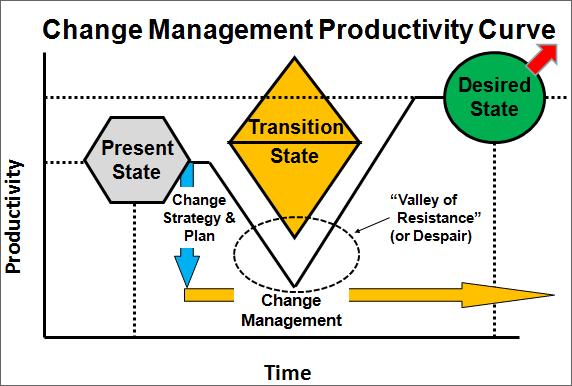
Change Management Productivity Curve

Change Management Productivity Curve

By having a robust change management methodology and plan, disruptions to business productivity can be minimized until the desired change state is achieved.  

7)    The Organizational Change Model Facilitates Change Success & Greater Business Results

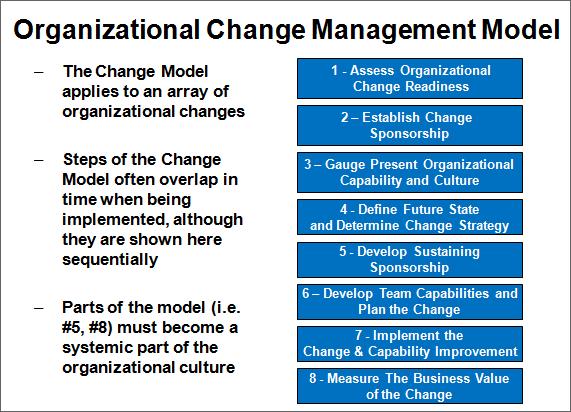
Organizational Change Management Model

Organizational Change Management Model

By having a robust change management methodology and model, change success and enhanced business performance can be nearly guaranteed.

8)    Steps in the Organizational Change Model Ensure Change Project Success

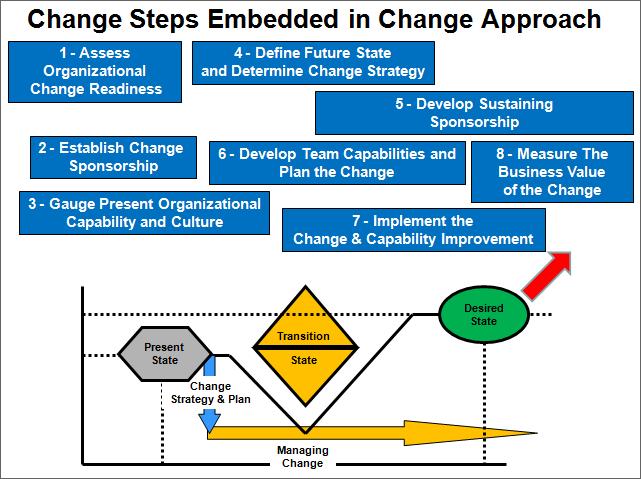
Change Steps in The Change Management Approach

Change Steps in The Change Management Approach

Change projects must have clearly defined and measurable steps that align with the overall change methodology.  This approach greatly enhances the chance that the change project will be successful as well as facilitates the achievement of desired-positive business outcomes.

9)    The Importance of the eight (8) Change Management Steps

The next set of graphs highlight the importance of each step in the change management (project) process:

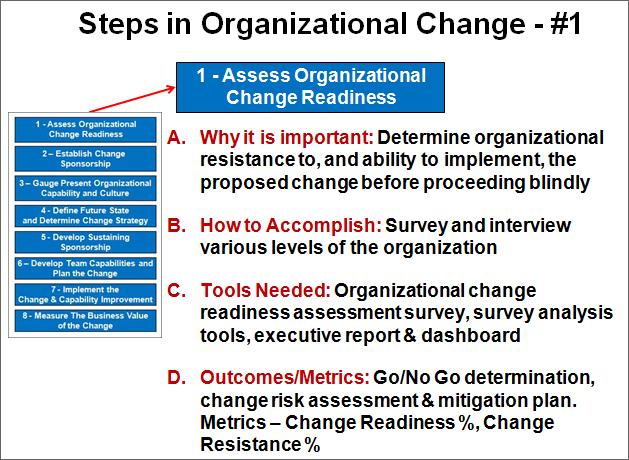
Step #1

Change Management - Step #1

Change Management – Step #1

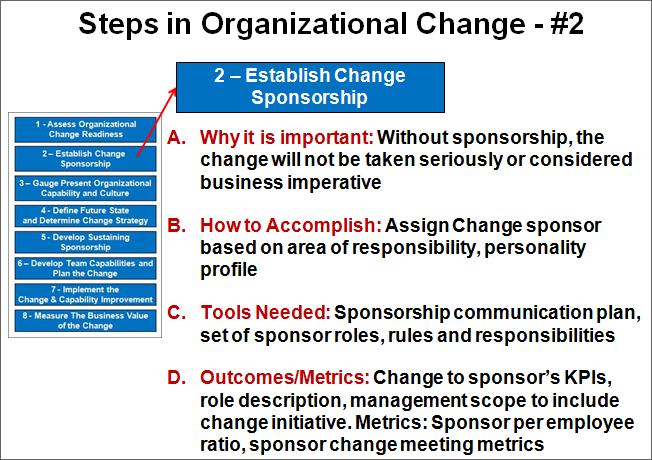
Step #2:

Change Management - Step #2

Change Management – Step #2

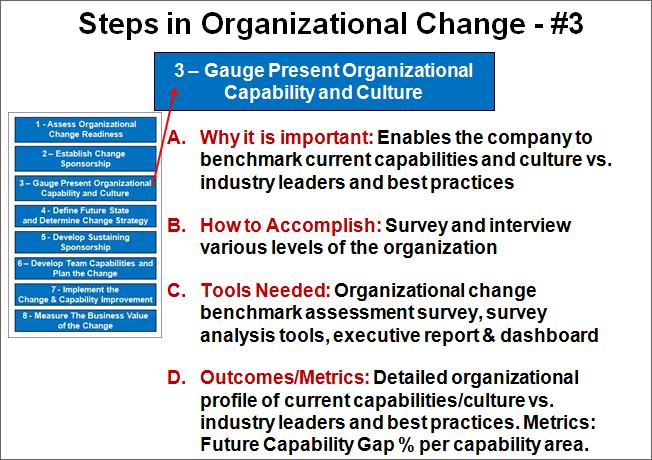
Step #3:

Change Management - Step #3

Change Management – Step #3

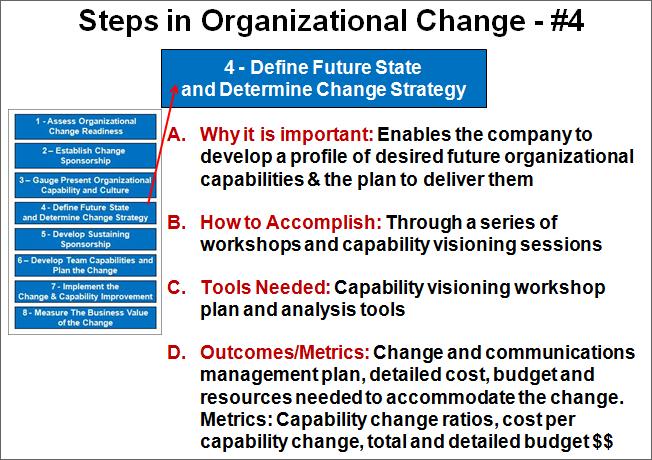
Step #4:

Change Management - Step #4

Change Management – Step #4

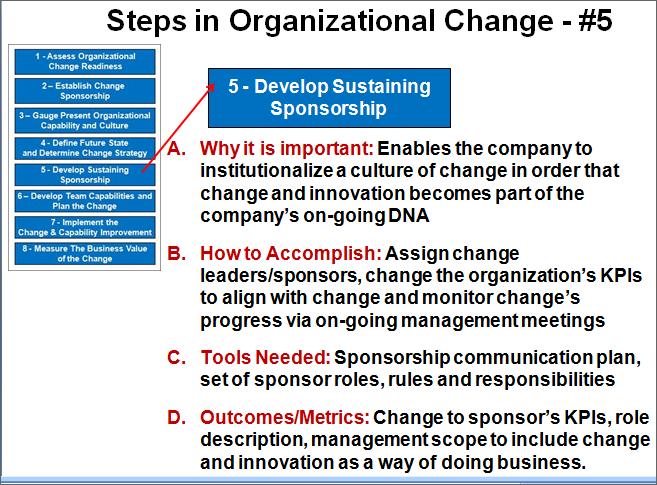
Step #5:

Change Management - Step #5

Change Management – Step #5

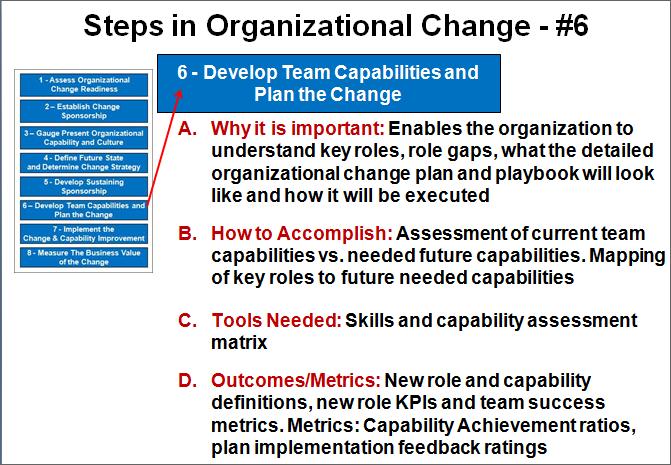
Step #6:

Change Management - Step #6

Change Management – Step #6

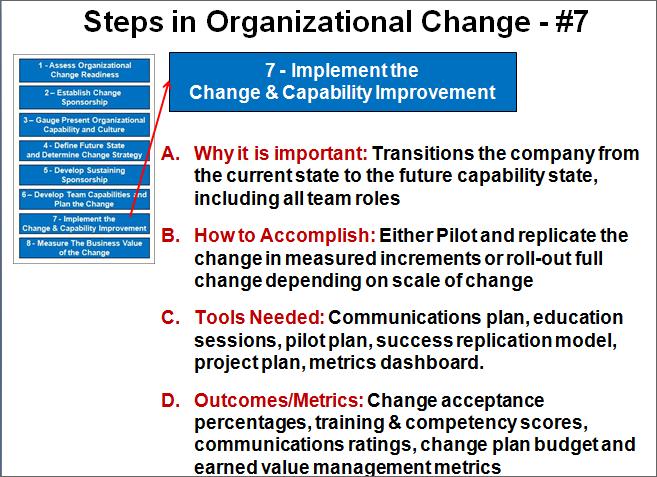
Step #7:

Change Management - Step #7

Change Management – Step #7

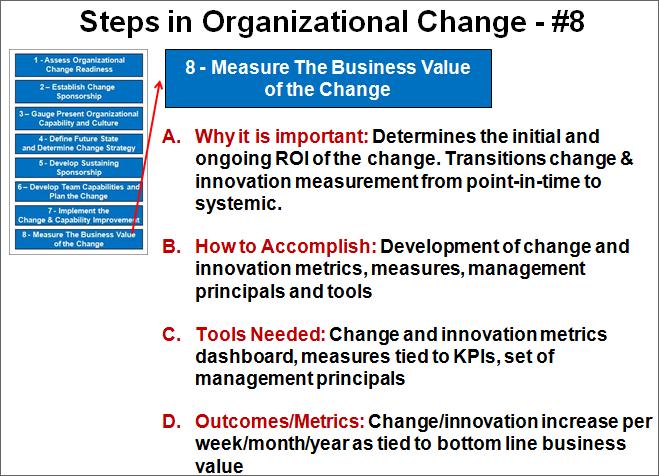
Step #8:

Change Management - Step #8

Change Management – Step #8

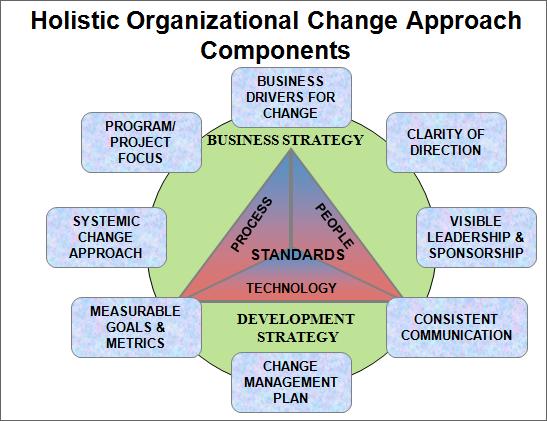
10)         Summary – Change Management & Innovation Requires a 360°, holistic approach

Holistic Organizational Change Components

Holistic Organizational Change Components

In summary, change management requires leveraging a proven change methodology, skilled change management practitioners and a holistic approach to implementing corporate innovation and change. The above is a simple depiction of a best practice approach I have used on many change management projects at many of the Fortune 500 companies in the US.

Sales Influencer (Power) Mapping

How to Win Key Strategic Sales Deals through Client Relationship Analysis, Management and Improvement – in 5 Easy Steps !

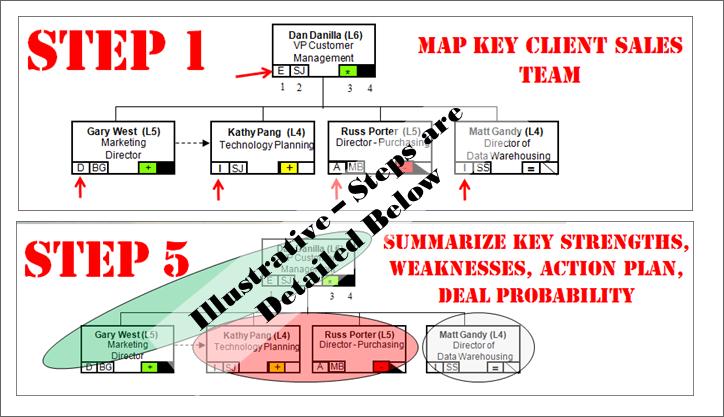
Illustrative of the 5 Step to Power Mapping (Ilustrative - Covered Below}
Illustrative of the 5 Step to Power Mapping (Ilustrative – Covered Below}

Analysis and Management of the key decision makers and influencers in any strategic and long-term sale is crucial for success and for obtaining that BIG SALES CONTRACT WIN. This type of analysis of multi-million dollar & strategic sales deals is a common practice of the top revenue generating firms throughout the world including Accenture, IBM, PricewatehouseCoopers, McKinsey, General Electric, Deliotte, KPMG, etc.  Through this proven sales analysis technique called Sales Influencer Mapping or Power mapping, you can quickly ascertain the following:

  1. How likely you are to win the deal based on the status of your relationships with the various client company team members?
  2. Who at your client company are for or against you and your firm winning this sale?
  3. Who from your client company has a pre-existing positive or negative perception of your company?
  4. What is the nature of your relationship with all of the key decision makers and influencers that must approve and/or condone this sale to your firm?

{Click on Chart for a larger/clearer image}:

Map Key Client Sales Team
Step #1 – Map Key Client Sales Team
Step #1 Legend
Step #1 Legend

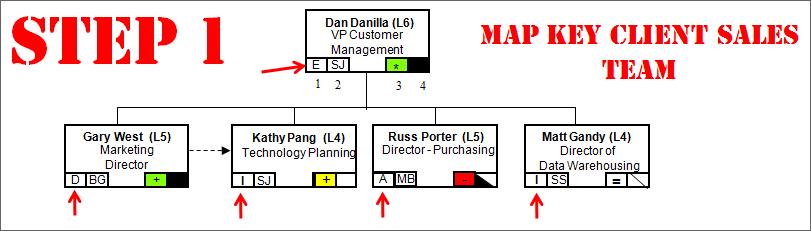
Directly related to the last bullet (#4) above, the first and key step to influencer mapping for longer-term strategic sales is determining the sales influencer landscape as follows:

  1. Who is the economic buyer(s) that has an allocated budget for the item you are selling and who will ultimately make the final decision for the sale? It is the economic buyer’s budget that will fund your sale of your product/service.
  2. Who are the decision maker(s) who the economic buyer must get to concur (sign-off) that they are selecting the right firm, solution, products for this sale? Decision makers are the people who are putting their reputations and careers on the line for selecting you and your firm for this sale.
  3. Who are the key influencer(s) that will influence the opinions and impressions of your company with both the economic buyer and the decision makers? It is the key influencer(s) who can help or hurt the chances of your sale with the economic buyer(s) and the decision makers.

Take Chart #1 below that represents a strategic sale of over $1.2MM to a potential pharmaceutical client. Our strategic sales team consisted of four of us attempting to sell a strategic roadmap for our client to enable an enhanced direct to consumer (DTC) pharmaceutical marketing model.

{Click on Chart for a larger/clearer image}:

Map Key Client Sales Team
Step #1 – Map Key Client Sales Team
Step #1 Legend
Step #1 Legend

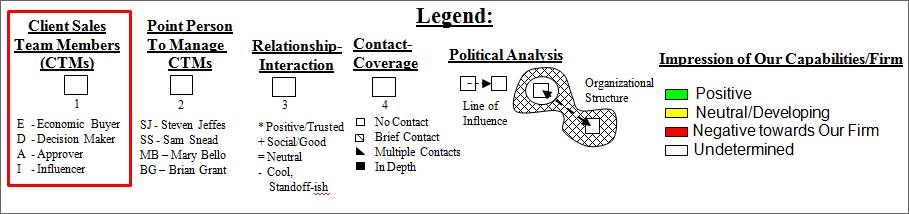
In step one, we carefully analyzed the client company organization and quickly determined that Dan Danilla, as VP of Customer Management, was the Economic Buyer for this sale and had adequate allocated budget to actually buy our services. You will notice the “E” noted below his name in box #1 for Economic buyer per the above power mapping legend.

Gary West was determined to be responsible for the project’s delivery and success, so he was labeled at the Decision Maker “D” in box #1 below his name/organizational box.

Russ Porter was determined as being one of the signatories of the contract, so he is marked with an “A” for being a contract Approver in box #1 below his name/organizational box.

Lastly, since Matt Gandy has a great social relationship with both Dan Danilla (Economic Buyer) and Gary West and is often called for professional advice by both, we marked him as a key influencer for this sales deal with an “I” in box #1 below his name/organizational box.

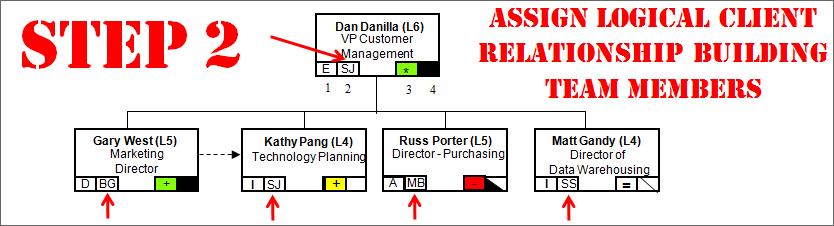
Chart #2 represents Step #2 in Sales Power Mapping {Click on Chart for a larger/clearer image}::

Assign Logical Client Relationship Building Team Members
Step #2 – Assign Logical Client Relationship Building Team Members
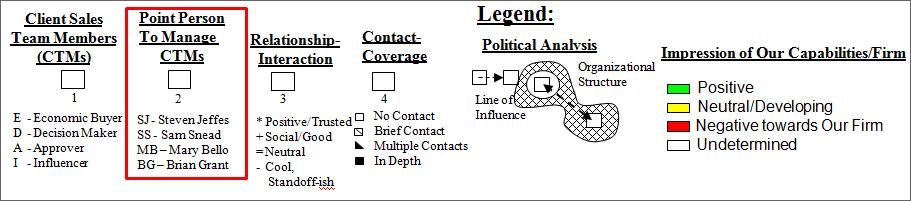
Power Mapping Step #2 Legend

In this step we assign our company team members to effectively manage the key influencer client relationships based on personality matching and previous interaction history.

In the above example, I (Steven Jeffes-SJ) was assigned to cover Dan Danilla (Economic Buyer) as I have had very good previous interactions with him and he seemed to like my ideas/insights.

Likewise Brian Grant (BG) was assigned to Gary West (Decision Maker), Me assigned also to Kathy Pang (Influencer), Mary Bello (MB) to Russ Porter (Approver) and Sam Snead (SS) to Matt Gandy as they head out for drinks together occasionally and have a budding social relationship.

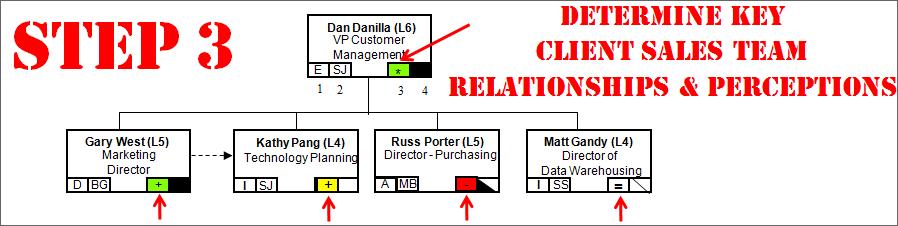
Chart #3 represents Step #3 in Sales Power Mapping {Click on Chart for a larger/clearer image}::

Determine Key Client Sales Team Relationship & Perceptions
Step #3 – Determine Key Client Sales Team Relationship & Perceptions
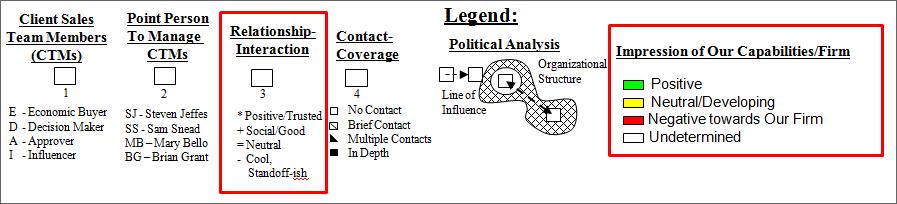
Power Mapping Step 3 - Legend
Power Mapping Step 3 – Legend

In this step we accomplish two bits of sales analysis as follows:

1)      We determine what our previous interaction with each person has been like and how have they reacted to our team members in the past (on average).  This is represented by box #3 above “Relationship Interaction”.  In box 3 for each client team member, we noted “*” for having a positive/trusted relationship with Dan Danilla, a “+” for having a good relationship with Gary West, a “+” also for Kathy Pang as she has a good relationship with Steve Jeffes, and “-“ with Russ Porter as he has been cool and stand-offish with team members and a “=” with Matt Gandy as he has been neutral in our previous interactions with him.

2)      Our second step in this phase is to determine what each person’s impressions are of our Firm’s capabilities based on any previous statements. We color the same box #3 with colors Green for Positive, Yellow for Neutral, Red for the person having negative impressions of our firm.  These colors are noted above in box #3 for each client team member – Dan Danilla (Green), Gary West (Green), Kathy Pang (Yellow), Russ Porter (Red), and Matt Gandy (White for undetermined).

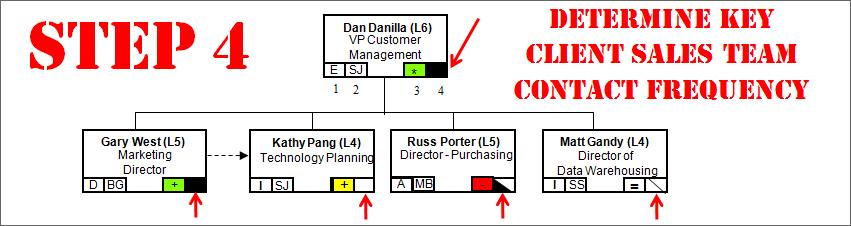
Chart #4 represents Step #4 in Sales Power Mapping {Click on Chart for a larger/clearer image}::

Determine Key Client Sales Team Contact Frequency
Step #4 – Determine Key Client Sales Team Contact Frequency
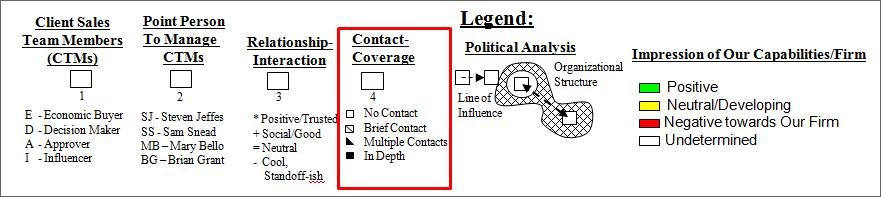
Power Mapping Step #4 - Legend
Power Mapping Step #4 – Legend

In this fourth step we accomplish the following:

Determine the extent to which we have had contact with each client sales team member. This step is critically important in order to be able to develop an effective action plan to help develop better relationships with each client team member.  In addition to noting the frequency of contact, detailed notes must be cultivated from each strategic sales team member to determine the following for each client team member:

1)      What previous concerns has the client team member mentioned when dealing with our team or when our potential solution was presented?

2)      What previous likes or preferences has the client team member mentioned when dealing with our team or when our potential solution was presented?

3)      What type of personality type is this client team member – analytical, introverted, social, extroverted, etc. (Should also be used in matching team members in step #2 above)
4)      What checkpoints or process steps is this client team member looking to ‘check off’ as part of this product/solution evaluation?

5)      Are there any other team stakeholders missing in developing the above organization chart that should now be added?

In the fifth and final step of this process, we perform the following:

A)     Aggregate and summarize the above sales analysis including deal strengths & weaknesses

B)     Develop a Sales Action Plan

C)     Estimate Deal Probability Closure %

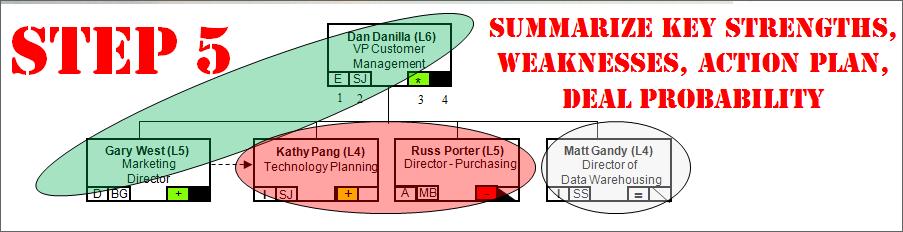
The picture that summarizes the sales analysis can be shown as follows {Click on Chart for a larger/clearer image}::

Summarize Sales Deal Key Strenghts, Weaknesses, Action Plan, Closure Probability (%)
Step #5 – Summarize Sales Deal Key Strenghts, Weaknesses, Action Plan, Closure Probability (%)

A)     Summarize Sales Analysis:

The summary of our sales analysis (as depicted in Chart #5 above) for this sale deal is as follows:

  1. We have good and strong relationships with Dan Danilla (Economic Buyer) and Gary West (Decision Maker) putting us in a good position to win the deal.
  2. We have weaker relationships with Kathy Pang (Deal Influencer) and Russ Porter (Deal Approver) and these relationships need to be strengthened via our sales action plan. They also have either neutral or negative impressions of our firm as compared to our competitors.
  3. Matt Gandy (Deal Influencer) has a neutral position in terms of relationships with our team members and impression of our firm’s solutions and capabilities. 

B)     Develop a Sales Action Plan (Sample):

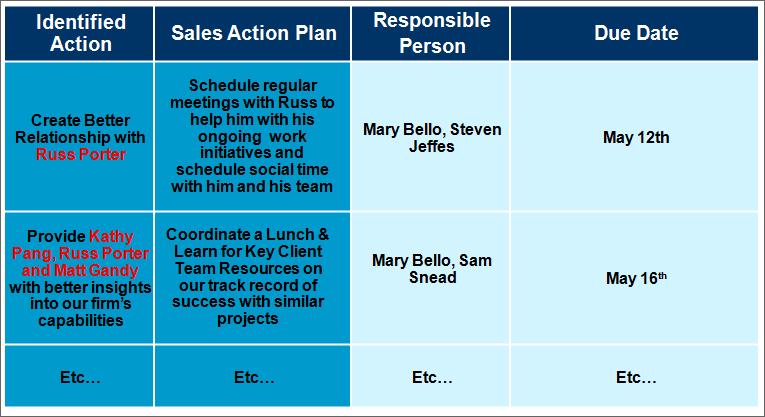
The action plan that aligns to our above sales analysis for this sales deal is as follows {Click on Chart for a larger/clearer image}::

Sales Power Mapping - Action Plan
Sales Power Mapping – Action Plan

C)     Estimate Deal Probability Closure %:

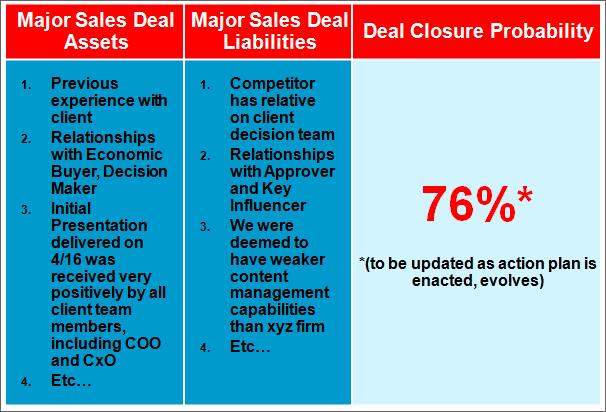
The final step is to estimate, utilizing all of the above insights, as well as major sales deal assets and liabilities, the probability that this sales deal will close favorably (as a win) for our firm as follows {Click on Chart for a larger/clearer image}::

Sales Power Mapping - Sales Deal Summary Assets, Liabilities, Closure Probability %
Sales Power Mapping – Sales Deal Summary Assets, Liabilities, Closure Probability %

The bottom line to sales power (influencer) mapping is that the best sales companies and your most formidable competitors are using this level of sales analysis and action planning in order to win that strategic multi-million $$$ deal.

Your organization will be at a competitive disadvantage if you do not employ this level of rigor in your sales pursuits. Trust me, it works and I have closed many large multi-million $$$$ deals (including this one – YES, the above example was A WIN!) using this technique at many of the world’s leading firms. 

The 80/20 Customer Profitability Rule

Develop intelligent customer service & customer management programs based on customer value insights…

Has your business ever performed an analysis of your customer base to determine any of the following:

1)      Which customers are frequent visitors and have the greatest repeat business?

2)      Which ones rarely do business with your company?

3)      Which ones are the most valuable and profitable to your company?

If you haven’t then you really don’t have the insights necessary to really develop an effective customer service, customer management and/or loyalty program.  In performing analytics and customer analysis for nearly 10% of the Fortune 500 companies in the United States, I have found a very revealing and astonishing pattern (rule) in this customer analysis that holds true company after company.  The pattern is as follows:

80% of all company profits are derived from ~20% of your customers

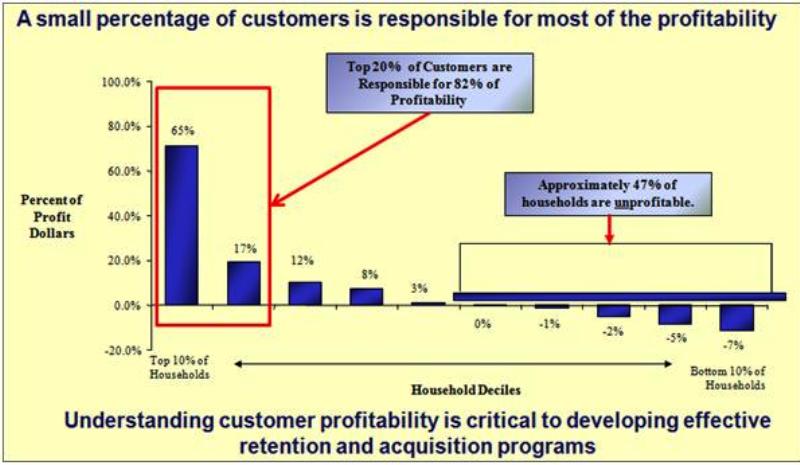
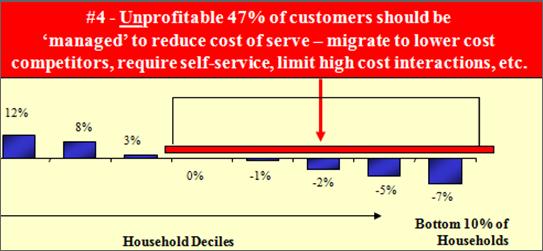
Take the chart below (Chart 1) from one of the top US banks that shows 20% of their customers are responsible for 82% of their profitability and that a full 47% of customers are actually unprofitable and not worth having as customer as each transaction costs the bank more than it is worth (each customer interaction/transaction actually drives the bank further away from profitability) {Click on Chart for a larger/clearer image}:

80% of all company profits are derived from ~20% of your customers

80% of all company profits are derived from ~20% of your customers

When I presented this customer profitability analysis to the bank, the bank executives were amazed at the results and of the customer profitability distribution. (Note – The deciles were developed using a SAS generated RFM analytics model whereby Recency (How recent customer have visited/purchased), Frequency (How frequently customers have visited/purchased and when they visited/purchased) and Monetary spend (How much they spend and on what types of products/services they spent their $$ on). The RFM model was then used as input into a profitability model, using actual profit data for each product/service/customer using a unique customer id to match the profit data to the RFM score.)Why are these insights and analytics so important and what might the bank or any other business do to manage customer relationships more effectively?  These insights are key in developing a customer relationship management (CRM) and loyalty program that is tailored and specific to each customer group. 

Note: The 80/20 rule applies to companies that have higher transaction volumes, a diverse set of product & services and a heterogeneous customer base.

Ask yourself the following questions:

  1. Should your company treat your best and most profitable customers differently than other, less profitable customers?
  2. Should your company develop special customer programs so that the 20% most profitable customers are not lured away by competitors?
  3. Do you think your company’s most profitable and valuable customers want to be shown appreciation for their repeat and profitable business in a way that makes them feel welcome and special?
  4. Is it in your company’s best interest to want to develop strategies and programs that turn unprofitable customers into profitable or at least revenue neutral customers?

The answer to all four questions should be a resounding YES!

Armed with the above insights and analysis a company can start to architect customer intimacy and loyalty programs such as the following:

  1. Offer most profitable customer special discounts or accelerated loyalty rewards earning rates
  2. Conduct special top customer, by invite only, appreciation events
  3. Deliver occasional special top customer gifts or recognition when they interact with you in-person or on-line
  4. Invite your top 1-5% of customers to participate in an invite only customer advisory board or insights group event every year at an exciting destination where most or all expenses are paid for by your company
  5. Develop unprofitable customer management programs such that these customers become more profitable, cost less per company transaction and/or they are effectively ‘encouraged’ to migrate to competitors.

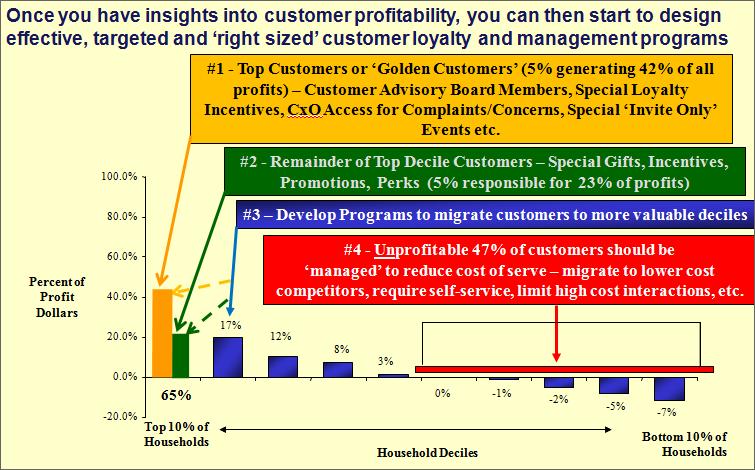
Take the same chart above and now overlay customer treatment programs to each customer decile and sub-segment (Chart 2) {Click on Chart for a larger/clearer image}

Effective Customer Management Programs Based on Profitability Insights

Effective Customer Management Programs Based on Profitability Insights

Even though decile #1 (10% of all customers) has been identified as the most valuable customer segment generating 65% of all company profits, the decile can then be further sub-segmented based on further profitability analysis/decomposition.  In this particular case:

  1. The top 5% of the top profitability decile customers generated 42% of all profits
  2. The remaining 5% of the top profitability decile customers generated 23% of profits

As shown in the ‘golden’ box (#1) above and below, these top tier customers should be given special access and special attention and made to feel totally appreciated and a partner of the company. The golden box also demonstrates the types of special programs you might want to provide to this top profitability group. It is of your utmost importance to do everything in your company’s power not to lose these most valuable/profitable customers. These suggested treatments are just a sample, but ones I have developed for many clients in the past, including top tier banks, retailers, life sciences companies, telecommunications providers, etc. {Click on Chart for a larger/clearer image}:

Top 5% of Customers Receive Platinum Plus Customer Programs

Top 5% of Customers Receive Platinum Plus Customer Programs

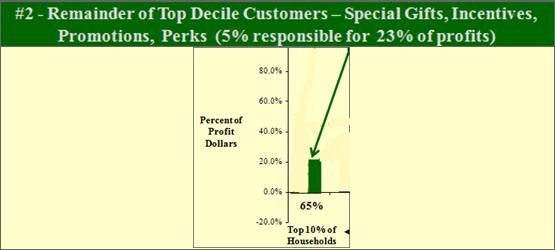
The next (Green) group of profitable customers highlighted in box #2 (below) can receive special treatment as well, but not quite the golden treatment as the most profitable 5%. These next valuable set of customers would still receive top customer treatment, but not quite the platinum access that the most valuable 5% would receive. You wouldn’t want to lose these valuable customers either, so their treatment would still be special, memorable and differentiated vs. your competitors. {Click on Chart for a larger/clearer image}:

Next Top Set of Customers Receive Top Treatment, but not Special Access, Handling Like the top 5% (Platinum) Group

Next Top Set of Customers Receive Top Treatment, but not Special Access, Handling Like the top 5% (Platinum) Group

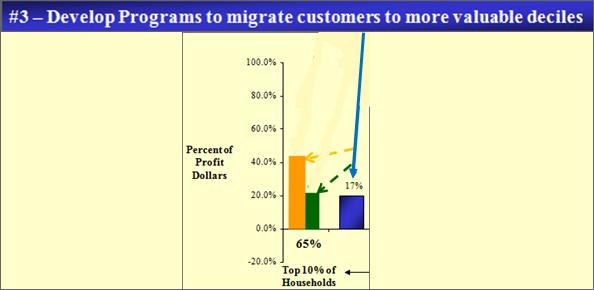
The blue box (#3) in the chart below speaks to customer migration programs that incentivize customers to spend more, visit your company (physical or online) more, purchase higher value items, buy in bundles, etc. {Click on Chart for a larger/clearer image}:
Effective Customer Management Programs Effectively Transition Customers into More Valuable Customers Over Time

Effective Customer Management Programs Effectively Transition Customers into More Valuable Customers Over Time

One very effective way to do this is to develop what I call modeled incentives. In that, if a loyalty program is to be effective there should be an incentive for the customer to model the behavior to achieve the next loyalty reward level and the following must be present:

1)      Every customer group must know what they need to do to achieve the next loyalty rewards level

2)      Customers need to feel the next loyalty rewards level is significantly more valuable than their existing level

3)      There should be prestige and/or notoriety associated with achievement of the next loyalty rewards level so that customers feel privileged, special and differentiated from regular customers.

Lastly, the red box (#4) below speaks to customer management programs that need to either turn these unprofitable customers into profitable customers or find ways to reduce the cost to serve these unprofitable segments. Some strategies including limiting these customers to self-service, providing incentives to transact during off hours, incentivizing them to seek lower cost providers, etc. {Click on Chart for a larger/clearer image}:
Effective Customer Management Program Also Address Unprofitable Customers

Effective Customer Management Program Also Address Unprofitable Customers

The bottom line is that, through customer insights and analytics, you will find that not all customers are the same in terms of profitability (the 80/20 rule), therefore it makes no sense whatsoever to treat all customers the same. Through a robust customer insights program you will then be able to leverage these insights and develop a sophisticated and custom loyalty and retention program in order to accomplish the following:
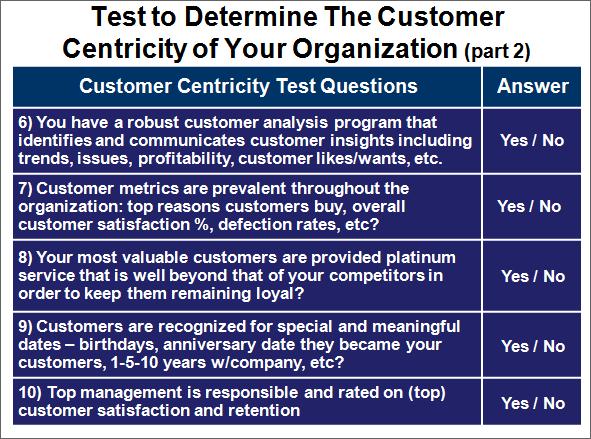
  1. Develop break-away tier 1 (Platinum) loyalty programs that stand alone in the industry such that your top 1-5% most valuable customers would not even consider defecting to another provider
  2. Develop programs to retain your most profitable customers and make them want to remain a loyal customer
  3. Develop a loyalty migration path for customers to want to achieve the next loyalty rewards level (Silver, Gold, and Platinum) so that they simultaneously feel more recognized/special/connected to the company while providing your company great value/profits/monetary return.
  4. Develop programs to mitigate expenses when dealing with your least profitable customers (more self-service, helping them ‘discover’ lower cost competitors, offering more limited services, etc.) (the other 80%)